Backtest Option Strategies Like a Pro
If a stock moves past your strike, the option can be assigned — meaning you'll have to sell (in a call) or buy (in a put). Knowing the assignment probability ahead of time is key to managing risk.
Posted by
Related reading
A Step-by-Step Covered Calls Example for Consistent Income
Unlock consistent income with our step-by-step covered calls example. This guide breaks down the strategy, risks, and outcomes to help you trade confidently.
Long Call and Short Put The Ultimate Synthetic Stock Guide
Unlock the power of the long call and short put strategy. This guide explains how synthetic long stock works, its benefits, risks, and how to execute it.
What is a Call Spread? A Clear Guide to Bull and Bear Spreads
What is a call spread? Discover how bull and bear spreads limit risk and sharpen your options trading strategy.
Backtesting an options strategy is just a fancy way of saying you’re simulating a trading idea using historical market data. The goal? To see how it would have performed in the past without putting a single dollar on the line. It's how you move a strategy from a "what if" scenario to something you can actually measure and test before a live trade.
Why Backtesting Is Your Secret Weapon in Options Trading
Look, before you risk real money on a new options strategy, you need confidence. But that confidence can't come from a gut feeling or some hot tip you saw online. Real, lasting confidence is built on data, and that’s exactly what backtesting gives you.
Think of it as a flight simulator for traders. A pilot would never dream of flying a new jet without logging countless hours in a simulator. So why would you trade a new strategy without seeing how it handles different market conditions first? This is how you turn a theoretical concept into a set of hard performance metrics you can actually use.
From Theory to Actionable Data
Instead of just hoping a strategy works, backtesting hands you the cold, hard numbers. You can stop guessing and start asking specific, data-driven questions.
What can you get from this process?
- Strategy Validation: Does the logic behind your trade entries and exits actually hold up under real-world pressure?
- Risk Assessment: It shines a light on the ugly parts, like how much you could have lost during the worst stretches (your maximum drawdown).
- Performance Expectations: It helps you set realistic goals by showing you historical win rates, average profits, and other key numbers.
It's easy to think backtesting is about predicting the future. It's not. The real value is in stress-testing your rules and building a data-driven process. That’s what separates the pros from the amateurs.
Setting the Stage for Smarter Trading
The insights you get from a proper backtest are invaluable. For example, you might have a strategy with a high win rate that actually loses money over time because of a few catastrophic losses. You'd never know that without running the numbers.
Modern platforms make this incredibly accessible. Some give you more than a decade of historical data, letting you set super-detailed parameters like strike delta and specific exit rules before running a simulation. You can see how this works by exploring research from platforms like tastytrade.
Ultimately, backtesting builds the discipline you need to succeed. It forces you to define every single part of your strategy—from entry triggers to exit rules—so there’s no room for emotional, in-the-moment decisions when your money is on the line.
By running these historical simulations, you're not just testing a strategy; you're building a robust, repeatable process. For a deeper dive into creating this process, check out our complete guide on how to backtest options strategies with Strike Price.
Assembling Your Backtesting Toolkit
A powerful backtest really comes down to two things: top-notch data and the right software. Think of it like a chef needing fresh ingredients and sharp knives. Without them, the meal is a flop. For traders, that means getting your hands on accurate historical options data and a solid platform to run your simulations.
Get these two pieces right, and you're already halfway to generating results you can actually trust.
The entire foundation of any effort to backtest option strategies is the data. It's the classic "garbage in, garbage out" scenario—if your data is flawed, your conclusions will be too.
Choosing Your Data Granularity
Not all data is created equal, and the kind you need is dictated entirely by the strategy you're testing. The frequency of the data, whether it's daily, hourly, or minute-by-minute, is a critical choice you have to make upfront.
For longer-term strategies, like selling covered calls 45 days out (DTE), End-of-Day (EOD) data might do the trick. It gives you a daily snapshot of prices and is usually cheaper and easier to handle.
But for anything fast-paced, EOD data is basically useless. If you’re trading options that expire the same day (0DTE) or within a few days, you absolutely need high-frequency, intraday data—think 1-minute intervals. The price of a short-term option can whip around in minutes, and EOD data misses all that critical action.
Key Takeaway: The precision of your backtest is directly tied to the granularity of your data. Using daily data for an intraday strategy is like trying to navigate a city with a map of the entire country—you'll miss all the critical turns.
The good news is that access to detailed historical data has been a game-changer. Some platforms now give traders access to years of 1-minute interval options data, which makes it possible to accurately simulate time-sensitive strategies like 0DTEs. You can discover more about high-frequency data on optionalpha.com.
The table below breaks down which data frequency works best for different types of strategies, helping you pick the right tool for the job.
Choosing the Right Data for Your Strategy
| Data Granularity | Best For Strategies Like | Pros | Cons |
|---|---|---|---|
| End-of-Day (EOD) | Covered Calls, Cash-Secured Puts (30-60 DTE) | Affordable, easy to manage, good for long-term trends | Misses all intraday price action, useless for short-term trades |
| Hourly | Swing trading, multi-day holds | Better precision than EOD, captures some intraday moves | Can still miss rapid price spikes, not ideal for scalping |
| 1-Minute | 0DTE, scalping, earnings plays, credit spreads | Extremely precise, captures volatility and fast moves | Large file sizes, more expensive, can be complex to work with |
| Tick-by-Tick | High-Frequency Trading (HFT), market making | The most granular data possible | Massive datasets, very expensive, overkill for most retail traders |
Ultimately, matching your data's detail to your strategy's timeframe isn't just a best practice—it's essential for getting results that reflect reality.
Finding the Right Backtesting Software
Once you've got your data lined up, you need a platform to crunch the numbers. Your choice will boil down to your budget, coding skills, and how complex your strategies are. The tools out there generally fall into three buckets.
1. Integrated Brokerage Platforms A lot of online brokers now offer their own backtesting tools. This is often the easiest place to start since it's built right into the platform where you'll be placing trades.
- Pros: Super convenient, no setup needed, and usually free if you have an account.
- Cons: Can be pretty limited, might not support custom or complex strategies.
2. Specialized Backtesting Software These are dedicated platforms built from the ground up to backtest option strategies. They offer way more power and customization than what brokers provide, often including massive historical datasets and even no-code strategy builders.
- Pros: Powerful and flexible, designed specifically for options, and gives you deep performance metrics.
- Cons: Almost always requires a subscription, and there can be a bit of a learning curve.
3. Custom Python Scripts
For the ultimate in control and flexibility, many serious traders just build their own backtesting engine with Python. Using libraries like pandas and numpy, you can test literally any idea you can cook up.
- Pros: Limitless customization, total control over assumptions like slippage and commissions, and can be cheap if you have the skills.
- Cons: Requires strong coding knowledge, takes a ton of time to build and maintain, and you're on your own for sourcing and cleaning data.
Your choice of tools will shape your entire backtesting process. A beginner might start with their broker’s tool to learn the ropes, while a quant trader will almost certainly want a custom Python setup. The key is to pick the tools that fit both your skills and your trading ambitions, so you can test your ideas with confidence.
Alright, theory is one thing, but the real test is seeing how a strategy actually performs. Let's get our hands dirty and build a complete backtest from scratch. We’ll walk through a common, real-world example: selling a short put spread on the SPY ETF.
This process gives you a blueprint you can use again and again. It doesn't matter if you're using a no-code platform or writing your own Python script—the core logic and the parameters you need to define are always the same. The key is to create a set of clear, ironclad rules that leave no room for guesswork.
Setting Up the Backtest Environment
First things first, we need to define the world our backtest will live in. The most important decision is the backtest period. This date range dictates the market conditions your strategy will have to navigate. A short period might give you skewed, lucky results, while a longer one puts the strategy through a much more rigorous stress test.
For our SPY short put spread, we need a substantial timeframe to make sure we're not just cherry-picking a friendly market. We want to see how it handles bull runs, sharp downturns, and periods of both high and low volatility.
- Underlying Ticker: SPY (SPDR S&P 500 ETF Trust)
- Backtest Period: January 1, 2010, to December 31, 2023
This 14-year window is solid. It gives us more than enough data to see how the strategy would have fared during the volatility spikes of the 2010s, the 2020 pandemic crash, and the 2022 bear market. This is a much more honest assessment than just testing over the last two years of a bull market.
Remember, the quality of your historical data is everything. Garbage in, garbage out. It’s worth your time to explore essential data cleaning techniques to make sure your results are actually reliable.
This whole data preparation stage is the bedrock of any serious backtest, as you can see here.
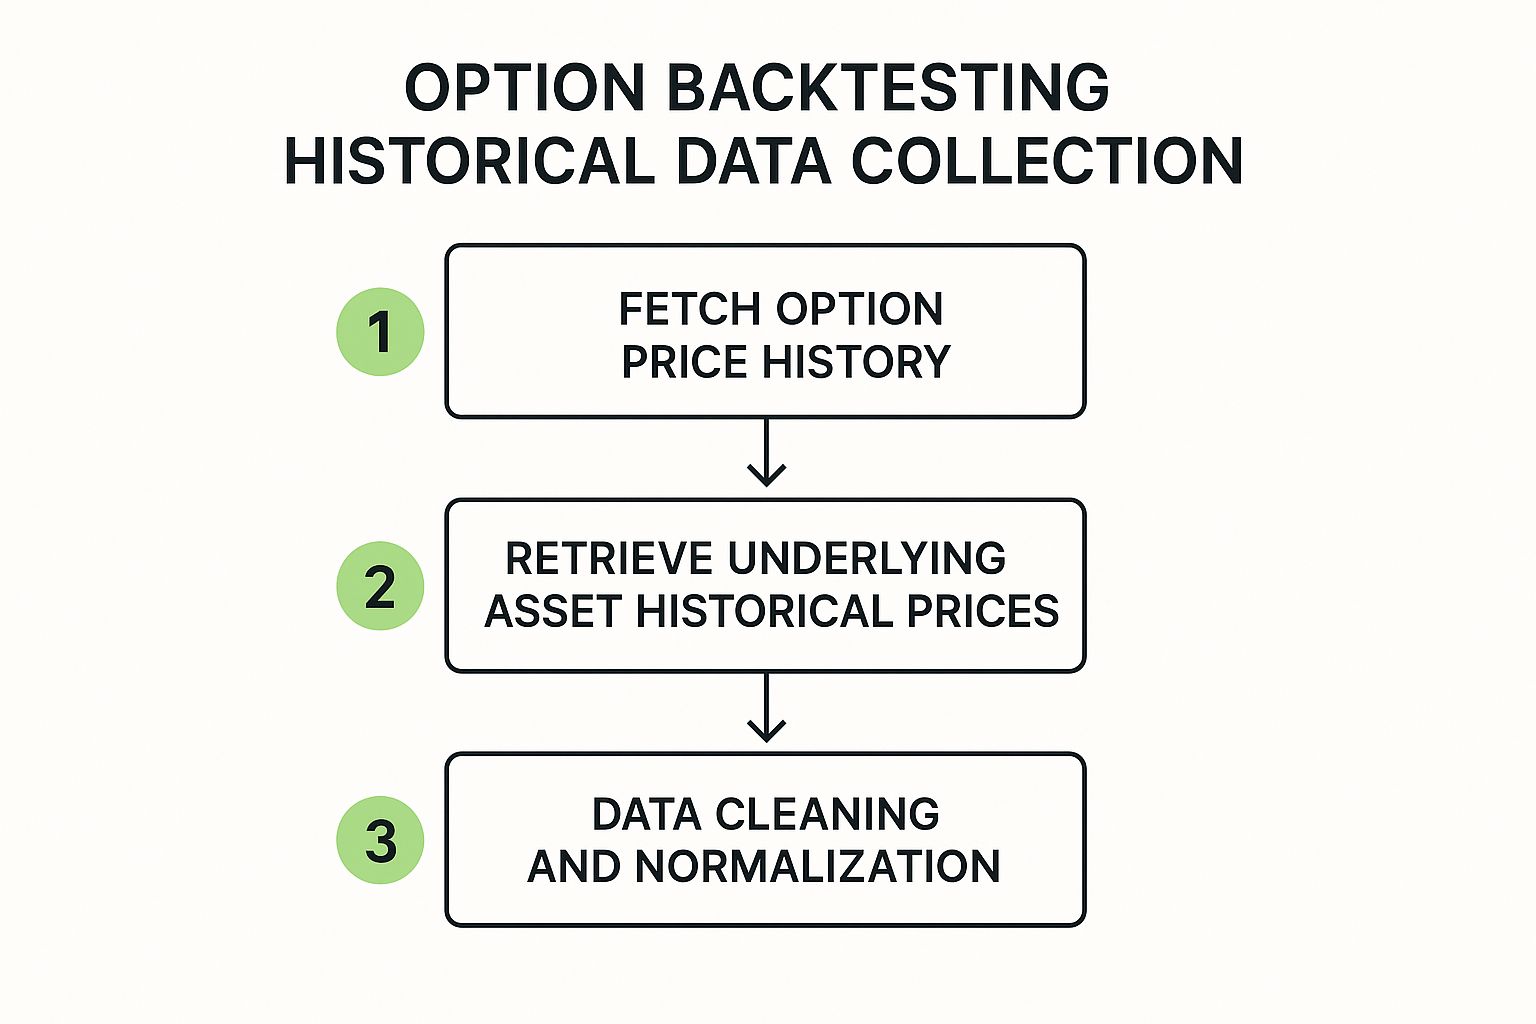
As the chart shows, getting your data ready is a critical, multi-step process that you have to nail before you can even think about applying strategy rules.
Defining Crystal-Clear Entry Rules
Now we get to the heart of the strategy. Vague rules like "sell when the market looks weak" are completely useless for a backtest. We need precise, numbers-based triggers that a computer can follow to the letter.
For our short put spread, a common approach is to sell premium when volatility is high. So, that's what we'll build our rules around.
- Volatility Filter: We'll only open a new trade when the Implied Volatility Rank (IV Rank) on SPY is above 50. This helps ensure we're selling options when they are relatively "expensive."
- Trade Frequency: We'll keep it simple and only open one position at a time. A new trade can only be placed after the previous one is closed.
- Days to Expiration (DTE): We'll look for the expiration cycle that is closest to 45 DTE. This gives the trade enough time to profit from time decay but avoids the extreme gamma risk of very short-dated options.
Once these conditions are met, the backtest knows it's time to execute the trade.
Specifying the Exact Trade Structure
Okay, so the entry signal has fired. Now what? The backtest needs to know exactly which options to "sell" and "buy." A professional way to do this is by using delta to select our strikes. This gives us a systematic way to structure the trade that adapts to the market, regardless of SPY's price.
Here’s the specific structure of our short put spread:
- Sell to Open: One put option with a delta closest to 30 (or -0.30). This is our short leg, where we collect the premium.
- Buy to Open: One put option with a delta closest to 10 (or -0.10). This is our long leg, which defines our maximum risk and lowers the capital required for the trade.
A delta of 30 can be roughly thought of as having a 30% chance of expiring in-the-money. By selling the 30 delta and buying the 10 delta for protection, we’re creating a high-probability trade with a clearly defined risk profile.
This mechanical approach using delta is way better than using fixed-dollar or percentage-based strike widths, which don't adjust as volatility ebbs and flows. If you're looking to play around with different setups like this, Strike Price is a great place to start your options strategy backtesting with some really intuitive tools.
Establishing Unambiguous Exit Rules
This might be the most overlooked—and most important—part of building a strategy. Too many traders obsess over the entry and then leave the exit up to fear and greed. A proper backtest needs disciplined, pre-planned exit rules for both winning and losing trades.
For our SPY spread, we’ll use a three-pronged exit plan:
- Profit Target: Close the entire spread if we can buy it back for 50% of the initial credit we received. So, if we sold the spread for a $2.00 credit, our order to close would be at $1.00.
- Stop Loss: Get out if the trade goes against us. We'll close the position if the loss hits 100% of the premium we collected. If we took in $2.00, we're out if the position shows a $2.00 loss.
- Time-Based Exit: If neither our profit target nor our stop loss gets hit, we'll close the trade automatically when there are 21 days left to expiration (DTE). This is a risk management rule to get us out before gamma risk really starts to ramp up near expiration.
These three rules cover our bases: the trade works, the trade fails, or the trade just meanders. By defining them so clearly, we've built a complete, testable system from start to finish. Now, all that's left is to hit "run" and see how this logic would have actually played out.
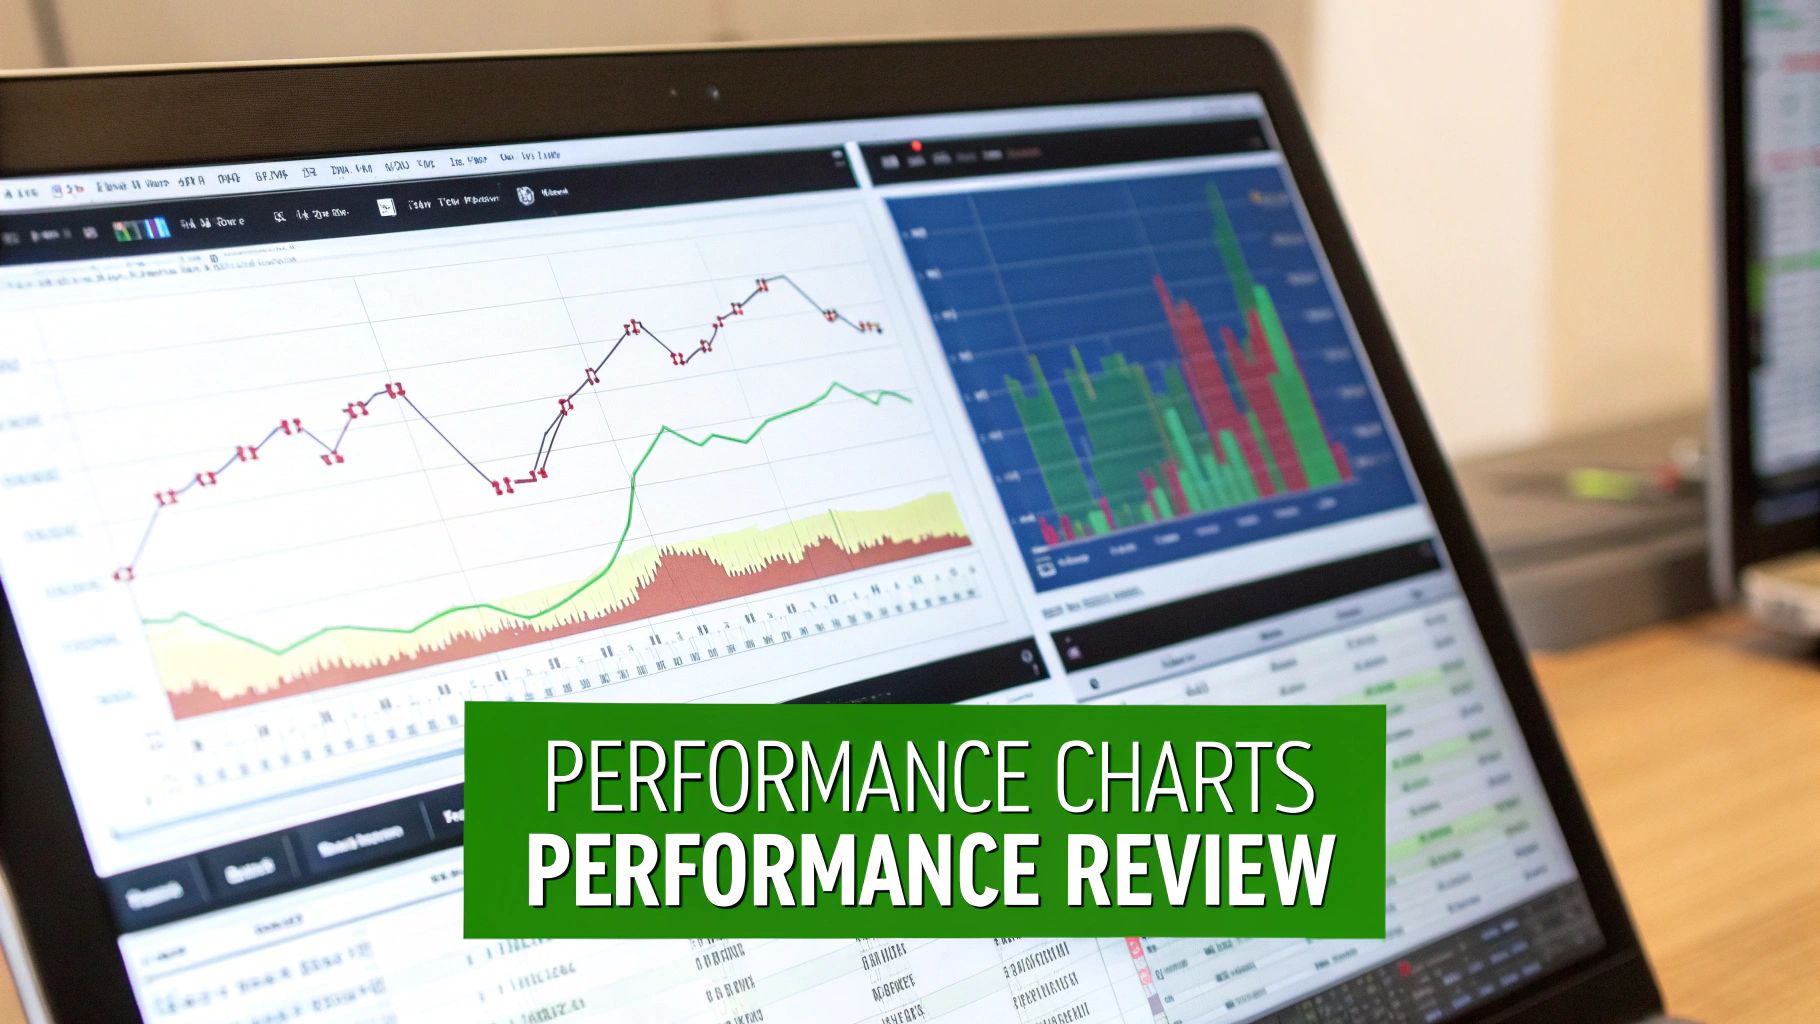
Decoding Your Backtest Results

Running the simulation is just the first step. The real work—and where profitable traders truly separate themselves from the pack—is in digging through the results. A simple total profit and loss (P&L) figure tells you almost nothing about a strategy's real character.
The goal here is to figure out if your strategy is genuinely robust or if it just got lucky during a specific market run. Once your backtest is done, you need to analyze it deeply. For those using spreadsheets, knowing how to analyze data in Excel can be a huge help for crunching the numbers and spotting trends.
Beyond the Total Profit and Loss
Think of the total P&L as a vanity metric. What really matters are the numbers that reveal the risk and consistency of your strategy. A smooth, steadily climbing equity curve is far more attractive than a volatile one that spikes and crashes, even if they both end up at the same profit number.
To properly backtest option strategies, you have to look at these core metrics:
- Maximum Drawdown (Max DD): This is the biggest drop your account took from a peak to a low. It’s a gut-check metric. It answers the question, "How much pain would I have had to stomach to stick with this?"
- Sharpe Ratio: This measures your return versus the risk you took. A higher Sharpe Ratio (anything over 1.0 is generally considered good) means you're getting more bang for your buck, risk-wise.
- Profit Factor: This is your gross profits divided by your gross losses. It tells you how much you made for every dollar you risked. A profit factor of 2.5, for instance, means you earned $2.50 for every $1.00 you lost—a very healthy sign.
A strategy with a 90% win rate sounds incredible, but it could easily be a catastrophic loser. If your average win is $100, but the average loss on the other 10% of trades is $1,000, you have a failing system. This is exactly why you can't just look at the win rate.
Modern analysis allows for insights on a massive scale. For example, some statistical backtests now crunch data on approximately 180 million options trades. By digging into such vast historical data, traders can spot subtle performance patterns that would otherwise be completely invisible. This is the kind of detailed work that moves you from just guessing to actually knowing.
Key Backtesting Performance Metrics Explained
To make sense of the output from your backtest, you have to know what each number is telling you. This table breaks down the most important metrics and explains why each one is critical for evaluating any options strategy you're considering.
| Metric | What It Measures | Why It's Important |
|---|---|---|
| Total Net Profit | The final P&L after all trades, commissions, and fees. | Provides the top-line result but should never be viewed in isolation. |
| Max Drawdown | The largest percentage drop from a portfolio high to a subsequent low. | Reveals the worst-case losing streak and tests your psychological tolerance for risk. |
| Win Rate % | The percentage of trades that were closed for a profit. | A high win rate feels good but can be misleading without context on average win/loss size. |
| Profit Factor | Gross profits divided by gross losses. | A crucial measure of profitability; anything above 1.5 is generally strong. |
| Average P&L per Trade | The average profit or loss across all trades. | Helps determine if the strategy has a positive expectancy over the long run. |
| Sharpe Ratio | The average return earned in excess of the risk-free rate per unit of volatility. | The classic measure of risk-adjusted return. Higher is better. |
| Sortino Ratio | Similar to the Sharpe Ratio, but it only penalizes for downside volatility. | Focuses on "bad" risk, making it very useful for options sellers who fear crashes. |
Understanding these metrics helps you build a complete picture of your strategy's behavior, moving well beyond a simple profit number.
Digging Into the Trade Log
Your backtesting software will spit out a detailed log of every single trade it simulated. Don't just glance at it—this is a goldmine. It's where you find the why behind the summary statistics.
Look for patterns. Are your losses clustered during periods of low volatility? Does your strategy get crushed around earnings? Answering questions like these is how you start refining your entry and exit rules.
For example, you might filter your trade log and discover your strategy prints money when the VIX is above 20 but bleeds cash when it's below 15. That single insight could lead you to add a volatility filter, dramatically improving your results and creating a much more robust system. This is the iterative process that turns a decent idea into a genuinely great strategy.
Avoiding Costly Backtesting Mistakes
Here's a hard truth: a flawed backtest is far more dangerous than no backtest at all. Why? Because it gives you a false sense of security that can lead to devastating real-world losses. The goal isn't to find a strategy that was a perfect fit for the past; it's to build one that actually works in the future.
This means you have to actively hunt down and eliminate the common biases and errors that can completely invalidate your results. Understanding these pitfalls is non-negotiable when you backtest option strategies. It’s what ensures your simulated performance has a fighting chance of translating to your live trading account.
Confronting Look-Ahead and Survivorship Bias
Two of the most common—and sneaky—errors are look-ahead bias and survivorship bias. They creep into your data and logic, creating an illusion of profitability that would have been impossible to achieve in real time.
Look-ahead bias happens when your backtest accidentally uses information that wouldn't have been available at the moment of the trade. For example, using a stock's closing price to decide on a trade you placed mid-day is a classic mistake. The fix? Be meticulous about your data timestamps. Every single decision must be based only on information available before the trade is executed.
Survivorship bias is just as deceptive. This pops up when you run a backtest on a current list of S&P 500 stocks over the last 20 years. The problem is your test conveniently ignores all the companies that went bankrupt, were acquired, or got delisted. You're only testing the "survivors," which will heavily skew your results and make them look way too good. To avoid this, you need a point-in-time dataset that includes all stocks that existed at that time, not just the ones still around today.
The Greatest Sin: Overfitting Your Strategy
The biggest mistake in all of backtesting is overfitting. This is when you tweak and refine your strategy parameters so perfectly that they match the random noise in your historical data, rather than a genuine market pattern.
Your strategy looks like a world-beater on paper but completely falls apart the second it faces new market conditions.
Imagine discovering that buying a call option on a Tuesday at 10:17 AM when the VIX is exactly 19.3 produced incredible returns over the last five years. You haven't found a market edge; you've just stumbled upon a random coincidence.
A backtest that has been over-optimized is nothing more than a history lesson. It memorizes the past instead of learning from it, making it completely unprepared for the unpredictability of the future market.
To fight overfitting, you absolutely must validate your strategy on data it has never seen before. Here are two powerful ways to do it:
- Out-of-Sample (OOS) Testing: Split your historical data into two sets. Build and optimize your strategy on the first set (the "in-sample" data, maybe from 2010-2020). Then, test its final performance on the second set (the "out-of-sample" data, from 2021-2024). If the performance tanks on the OOS data, your strategy is likely overfit.
- Walk-Forward Analysis: This is a more advanced, rolling version of OOS testing. You optimize your strategy on one chunk of data (e.g., 2010-2011), test it on the next (2012), and then slide the window forward—re-optimizing on 2011-2012 and testing on 2013. This process does a much better job of simulating how a real trader would adapt over time.
Accounting for Real-World Trading Frictions
A backtest that ignores real-world costs is pure fantasy. Things like commissions, slippage, and the bid-ask spread are the "frictions" that can grind a theoretically profitable strategy into dust. A backtest might assume you can always get filled at the mid-point price, but we all know that in reality, you buy at the ask and sell at the bid.
Here’s how to make your simulation much more realistic:
- Commissions: Add a fixed cost for every single opening and closing trade. Even a few dollars per trade adds up significantly over hundreds or thousands of simulations.
- Slippage: This is the difference between the price you expected and the price you actually got. You can simulate this by adding a small penalty to every trade, like assuming you get filled a penny or two worse than the going market price.
- Bid-Ask Spread: Instead of using the mid-price, your backtest must assume you buy options at the higher ask price and sell them at the lower bid price. This is one of the most significant costs for active options traders, and it absolutely has to be included.
By rigorously avoiding these biases and properly accounting for real-world costs, you can build a much more robust backtest. This diligence is a core part of successful trading, as it ties directly into how well you manage risk. To strengthen your approach even more, check out our detailed guide on options trading risk management to help protect your capital.
Your Questions on Backtesting Answered
As you start to backtest option strategies, you'll quickly realize that the same questions tend to surface. These are the practical, nitty-gritty details that can trip you up and stall your progress.
I've put together some direct answers to the most common queries I hear from traders when they first get into historical testing. Think of this as a quick reference for those "what if" scenarios that tutorials don't always cover. Nailing these fundamentals builds a much stronger foundation for all your testing.
How Much Historical Data Do I Really Need?
The right amount of data really just depends on your strategy's typical holding period. There's no single answer here, because a long-term strategy and a 0DTE trade are completely different animals.
For longer-term approaches where you might hold a position for 30-60 days, you should be looking for at least 5-10 years of historical data. This wide-angle view is crucial. It ensures your strategy has weathered multiple market cycles—bull runs, bear markets, and those frustrating sideways grinds.
On the other hand, for extremely short-term strategies like Zero-Days-to-Expiration (0DTE) trades, the game changes. Here, it’s less about the number of years and more about granularity. You absolutely need high-frequency, 1-minute intraday data to capture those rapid price moves. For 0DTE, 2-3 years of this granular data is a solid starting point. It provides plenty of variety in daily market conditions without being overkill.
Does a Good Backtest Guarantee Future Profits?
Not a chance. And it's critical to internalize this. A backtest is a historical audit of your trading logic, not a crystal ball. Its real job is to validate your rules, pinpoint potential risks like nasty drawdowns, and help you set realistic expectations for performance.
Think of a successful backtest as building a durable, all-weather vehicle. It's been engineered and stress-tested to handle rough conditions, but it can't predict the road ahead. Market regimes change, and past performance is never a guarantee of future results.
A positive backtest gives you confidence in your process, not in any specific outcome. It confirms that your strategy has shown a statistical edge in the past, which is the best starting point you can ask for before putting real capital on the line.
How Do I Factor Volatility Into My Backtest?
This isn't just a "nice-to-have"—it's essential for a robust and realistic backtest. Many of the most profitable options strategies are context-dependent. They behave one way in high-volatility environments and completely differently when markets are calm.
The best way to handle this is to build volatility filters directly into your strategy's entry and exit rules. This lets you test how your system performs under specific conditions.
Here are a few practical examples:
- Entry Filter: Program your backtest to only open new trades when the VIX is above a certain threshold, like 20.
- IV Rank Condition: Only sell premium when the underlying's IV Rank is above 50, ensuring you're getting paid fairly for the risk you're taking.
- Exit Trigger: Add a rule to close positions if implied volatility craters by a certain percentage after you've entered the trade.
By testing your strategy this way, you can build a more adaptive game plan. You'll know when your strategy is most likely to shine and, just as importantly, when it's probably best to sit on the sidelines.
Ready to stop guessing and start making data-driven decisions? Strike Price provides real-time probability metrics and smart alerts to help you find the best covered call and secured put opportunities. Turn your trading ideas into a consistent income process.
Discover how Strike Price can transform your options trading