Covered Puts Explained: Strategies for Bearish Income
If a stock moves past your strike, the option can be assigned — meaning you'll have to sell (in a call) or buy (in a put). Knowing the assignment probability ahead of time is key to managing risk.
Posted by
Related reading
A Step-by-Step Covered Calls Example for Consistent Income
Unlock consistent income with our step-by-step covered calls example. This guide breaks down the strategy, risks, and outcomes to help you trade confidently.
Long Call and Short Put The Ultimate Synthetic Stock Guide
Unlock the power of the long call and short put strategy. This guide explains how synthetic long stock works, its benefits, risks, and how to execute it.
What is a Call Spread? A Clear Guide to Bull and Bear Spreads
What is a call spread? Discover how bull and bear spreads limit risk and sharpen your options trading strategy.
Understanding Covered Puts: The Strategy Nobody Talks About
 Most traders know about covered calls, but its overlooked relative, the covered put, is one of options trading’s best-kept secrets. It’s a powerful approach if you think a stock is likely to fall or trade flat for a while. This strategy lets you collect income from a stock you are betting against, which opens up interesting possibilities in bearish markets.
Think of it as being a landlord, but in reverse. Instead of owning an asset and collecting rent, you are essentially "borrowing" stock and getting paid a premium for it. This is a central idea in our covered puts explained guide: you are merging two different financial moves into one unified strategy. It's a great fit for traders with a moderately bearish view who aren't predicting a total market collapse.
How Do Covered Puts Actually Work?
At its core, the strategy relies on two parts working together:
- Shorting the Stock: First, you open a short position in a stock. This means you borrow shares and sell them, hoping to buy them back later at a lower price to make a profit on the difference. For every 100 shares you short, you can execute one covered put contract.
- Selling a Put Option: At the same time, you sell (or "write") a put option on that same stock. When you sell this put, you receive an instant cash payment called a premium from the option's buyer. In return, you accept the obligation to buy the stock at a set price (the strike price) if the option gets exercised.
This combination is what makes the strategy work. A covered put is an options trading strategy where a trader sells a put option while also shorting the same amount of the underlying stock. It's mainly used in bearish or neutral markets to generate income from the option premium. You can read the full research on the performance of put-writing strategies to see how they have performed historically.
The "coverage" in a covered put is provided by your short stock position. If the stock price drops and the put option you sold is exercised, you are required to buy the shares. However, this action simply closes your original short position, which prevents a major loss on that part of the trade. This built-in safety net is what distinguishes it from riskier, undefined-risk strategies. For a closer look at basic options ideas, see our guide on option trading tutorials.
How Money Flows In Your Favor (And When It Doesn't)
To understand how a covered put makes you money, think of it like being a landlord who collects rent from two sources on the same property. The first source is the premium you get instantly for selling the put option—this is guaranteed income, like collecting rent upfront. The second potential source is profit from your short stock position as the price falls.
For this strategy to pay off, you need the stock to cooperate by either dropping in price or staying relatively flat. The real key to managing this trade is identifying your breakeven point, which is the line separating profit from loss.
Calculating Your Breakeven Point
Knowing your breakeven point is critical. It’s not just the price where you shorted the stock; the premium you collected gives you a valuable cushion against a price increase. The formula is straightforward:
Breakeven Price = Short Stock Entry Price + Premium Received Per Share
Let's walk through an example. Say you short 100 shares of a stock at $50 and simultaneously sell a put option, collecting a $2 premium per share ($200 total). Your breakeven price is now $52 ($50 + $2). This means the stock can actually rise against you by up to $2 per share before your position starts to lose money. Any price at or below $52 at expiration is either a profit or breakeven.
This cushion is a central advantage of the covered put strategy. The premium you receive directly raises your breakeven price, giving you a wider margin for error.
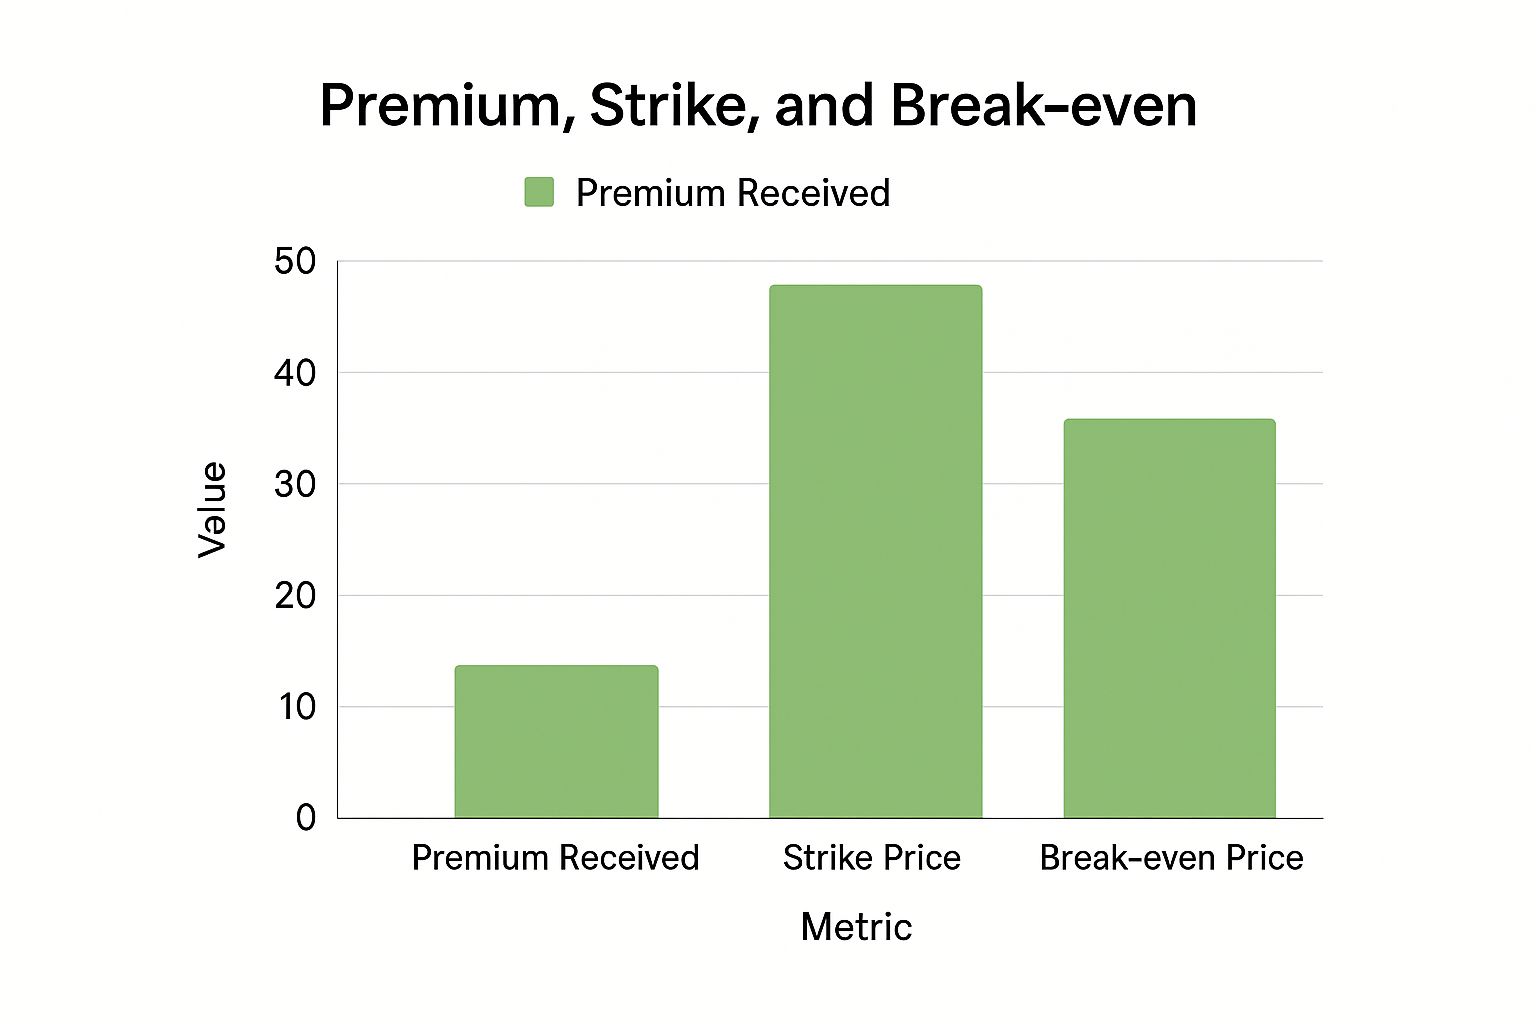
This visual shows how the premium you collect effectively lowers your financial risk by pushing the breakeven point higher.
Profit And Loss Scenarios
Your total profit or loss is determined entirely by where the stock price lands when the option expires. Let's explore the possible outcomes using our ongoing example: shorting a stock at $50, selling a $48 strike put, and collecting a $2 premium.
The following table breaks down the profit and loss at different stock prices, showing how the short stock and the put option work together.
Covered Put Profit and Loss Scenarios
Detailed breakdown of profit/loss outcomes at different stock price levels at expiration
| Stock Price at Expiration | Short Stock P&L | Put Option P&L | Total P&L | Return % |
|---|---|---|---|---|
| $45 | +$500 | -$100 (Assigned) | +$400 | +8.7% |
| $48 | +$200 | +$200 (Expires) | +$400 | +8.7% |
| $50 | $0 | +$200 (Expires) | +$200 | +4.3% |
| $52 | -$200 | +$200 (Expires) | $0 | 0% |
| $55 | -$500 | +$200 (Expires) | -$300 | -6.5% |
This table clearly illustrates how the premium provides a buffer. Even when the stock moves against the short position to $52, the trade still breaks even.
Here's a breakdown of the scenarios:
- Maximum Profit (Stock Price ≤ Strike Price): If the stock drops to $48 or below, the put option gets exercised. You are forced to buy the shares at $48, which perfectly closes out your $50 short position for a $2 per share gain. Add the $2 premium you already collected, and your total profit hits $4 per share ($400 total). This is your best-case scenario.
- Partial Profit (Strike Price < Stock Price < Breakeven): If the stock ends up between $48 and $52, the put expires worthless. You keep the full $2 premium and also profit from your short stock position. For example, if the price is $50, your short stock is flat, but the $2 premium gives you a net profit of $2 per share.
- The Loss Zone (Stock Price > Breakeven): Here’s where things get painful. If the stock rallies above your $52 breakeven point, your losses on the short position start to grow. That small premium you collected is quickly erased by the rising stock price. Because a stock's price can theoretically rise forever, your risk is unlimited, which is the biggest drawback of this strategy.
Reading Market Signals Like A Pro
 Success with covered puts isn’t about reacting to every dip; it's about spotting the ideal setup before everyone else does. This strategy performs best not in a full-blown market crash, but during periods of gentle downtrends or when a stock is trading sideways. These are the moments when both sides of your trade—the short stock position and the sold put—can work together effectively.
Think of it like sailing. You don’t want a hurricane (a market collapse) or a complete lack of wind (a rally against your short position). You’re searching for a steady, predictable breeze to guide you. For a covered put trader, that "breeze" is a stock expected to drift lower or trade in a tight range, giving time decay a chance to eat away at the value of the put option you sold.
Finding The Sweet Spot: Volatility and Sentiment
The most critical factor for timing your entry is implied volatility (IV). High IV leads directly to richer option premiums, meaning you collect more cash for selling the put. This is the heart of the strategy: you are essentially selling volatility. Pro traders actively look for stocks with elevated IV because it meaningfully improves the trade's risk-to-reward balance.
This extra premium you collect is called the volatility risk premium. It exists because the market often overestimates how much a stock will actually move in the future. Historically, implied volatility has been higher than the actual (realized) volatility by about 4.2% on average. This gap is what makes selling options a potentially profitable long-term approach. You can explore the data on put-writing strategies to see how this premium has historically benefited sellers.
To make this work for you, focus on identifying these conditions:
- High but Stable IV: Find stocks where IV is historically high but has recently stabilized or started to trend down. This can signal that market fear is peaking, creating an opportunity to sell expensive options.
- Bearish or Neutral Sentiment: Look for technical signals, like a stock breaking below a key moving average but not yet in a freefall. This can be a perfect entry point for a covered put.
- Appropriate Position Sizing: Adjust your trade size based on the volatility. Higher IV means more risk, so a smaller position is usually wise. When volatility is lower, you might consider a larger position to achieve your income targets.
What The Numbers Really Tell Us
The theory behind a covered put sounds great, but how does the strategy actually hold up over the long haul? To move beyond hypotheticals, we can dig into historical data to see what the numbers reveal about real-world returns and risks. This gives us a much clearer picture of what to expect.Performance Under The Microscope
While a covered put involves shorting a stock, its risk and reward profile is a close cousin to another income strategy: the cash-secured put. Luckily, a well-documented index tracks the performance of selling puts on the S&P 500, giving us decades of data to analyze.
A deep dive into the Cboe S&P 500 PutWrite Index (PUT) over a 32-year period from 1986 to 2018 offers some powerful insights. The strategy delivered an annual compound return of 9.54%, just a hair under the S&P 500's 9.80% during the same period. You can read the full study to discover more about these findings.
But the most compelling number isn't the return—it's the risk. The PUT index had significantly lower volatility, clocking in at 9.95% compared to the S&P 500's much rockier 14.93%. In simple terms, the journey was a whole lot smoother. To see the mechanics of a similar strategy in action, check out our cash-secured put example.
What This Means For Your Trading
The main takeaway here is that put-selling strategies have historically delivered stock-like returns with bond-like volatility. This combination leads to a superior risk-adjusted return, which is measured by a metric called the Sharpe ratio. The PUT index scored a Sharpe ratio of 0.65, comfortably beating the S&P 500's 0.49.
So, what does this mean for a covered put trader? It suggests the strategy's real power isn't about trying to outpace the market during a massive bull run. Instead, its value is in providing more consistent, less stomach-churning returns over time.
This historical data brings a few key truths into focus:
- Income Consistency: The strategy shines when it comes to generating a steady flow of income from option premiums.
- Volatility Reduction: It can act like a shock absorber for your portfolio, especially when the market is flat or trending slightly down.
- Realistic Expectations: You probably won't beat a roaring bull market, but you can aim for attractive returns with less of a rollercoaster ride.
This data-backed view proves that any guide on covered puts explained properly must highlight its role in creating smoother returns, not just chasing the highest profit possible.
When Things Go Wrong (And How To Survive It)
Every trading strategy has its weak spot, and for the covered put, it's a sudden, sharp rally in the stock price. While this strategy is a great way to generate income when you expect a stock to stay flat or decline, an explosive upward move is the nightmare scenario. If you're not prepared, the short stock component of your trade can lead to significant, theoretically unlimited losses.
The Anatomy of a Losing Trade
Let's walk through how a winning trade can turn sour. Imagine you believe a stock is overvalued, so you decide to set up a covered put. You short 100 shares at $50 and simultaneously sell a put option with a $45 strike price, collecting a $2 premium per share. This puts your breakeven price at $52.
But then, the unexpected happens. The company releases a stellar earnings report or receives a surprise buyout offer, and the stock skyrockets to $65.
That $2 premium you collected offers very little protection. Your short stock position is now bleeding money, down $15 per share for a total loss of $1,500. Meanwhile, your put option expired worthless, so you only get to keep the initial $200 premium. The final result is a painful $1,300 loss. This is the brutal reality of the unlimited risk tied to shorting stocks, where a single position can spiral out of control if the market moves hard against you.
Managing the Unmanageable: Risk Controls
Surviving these moments isn't about hope; it's about having a concrete plan. You need battle-tested risk management rules in place before you ever enter the trade.
- Ironclad Position Sizing: A cardinal rule is to never risk more than 1-2% of your trading capital on any single covered put position. This discipline alone can be the difference between a bad trade and a catastrophic one.
- A Hard Stop-Loss: Before you even click "buy," you must define your exit point. This is the price at which you'll close the trade, no questions asked. It could be your breakeven price or just slightly above. Once the stock hits that trigger, you close both the short stock and the short put to cap the damage.
- Portfolio Allocation: Don't put all your eggs in one bearish basket. A portfolio concentrated in strategies like covered puts is extremely vulnerable to a broad market rally. Diversification helps ensure that one strong up-move doesn't wreck your entire account.
The possibility of extreme losses isn't just a hypothetical. An analysis of in-the-money put options from 1986 to 1989 revealed just how wild the returns can be. The study documented an average 12-week return of -24.7%. While the best outcome was a 387.2% gain, the worst was a complete -100% loss. You can dive into the full data on these historical put option returns to see the wide range of possibilities for yourself.
Planning for these worst-case scenarios is critical. You can get a better handle on your trade's potential outcomes by using an options risk-reward calculator to visualize your profit and loss zones before committing any capital.
From Theory To Trade: Your Execution Blueprint
 Turning knowledge into action is where real trading begins. Now that we've unpacked the theory behind covered puts, it’s time to build a practical plan for executing your first trade. This strategy isn’t about acting on a simple bearish hunch; it requires a disciplined approach to picking the right stock and setting up the trade correctly.
Finding the Right Stock and Strike
The first step is identifying a stock you believe is overvalued and likely to either stagnate or experience a slight downturn. Just as important, the stock must have a liquid options market. High trading volume is key—it ensures you can enter and exit your position smoothly, avoiding wide bid-ask spreads that can quietly drain your profits. With total monthly options volume often topping 200 million contracts, there's plenty of liquidity out there. You can find more data on current options market volume on Optionistics.com.
Once you've picked your stock, the next decision is the strike price. This choice balances risk and reward:
- Out-of-the-Money (OTM) Puts: Selling a put with a strike price below the current stock price generates a smaller premium but gives you a larger buffer if the stock unexpectedly rises. This is the more conservative option.
- At-the-Money (ATM) Puts: Choosing a strike price close to the current stock price will yield a higher premium, but it leaves very little room for error if your outlook is wrong. This is a more aggressive move.
Executing the Trade in Your Brokerage Account
Placing a covered put involves two actions at once: shorting the stock and selling the put option. Thankfully, most brokerage platforms let you enter this as a single "combo" order. This helps ensure both parts of the trade are executed together at a favorable net price, preventing one leg from being filled without the other.
To guide you through the process, the following checklist outlines the key steps and considerations for setting up a covered put trade.
| Step | Action Required | Key Considerations | Risk Factors |
|---|---|---|---|
| 1. Stock Selection | Identify a stock with a bearish or neutral outlook. | Prioritize stocks with high options volume and tight bid-ask spreads to ensure liquidity. | An illiquid stock can make it difficult and costly to enter or exit the position. |
| 2. Establish Cover | Short 100 shares of the selected stock. | This is the "covered" part of the strategy, protecting you from unlimited upside risk. | If the stock price rises sharply, losses on the short stock position can grow quickly. |
| 3. Sell the Put | Simultaneously sell one put option contract. | This action generates the premium income for the trade. Ensure it's a "combo" order with the short stock. | Selling a "naked" put without the short stock cover exposes you to significant risk if the stock falls. |
| 4. Choose Expiration | Select an expiration date, typically 30-45 days away. | This window is often ideal for capturing the benefit of time decay (theta) without tying up capital for too long. | Longer-dated options are more sensitive to price changes and expose you to risk for a longer period. |
| 5. Set Risk Parameters | Define your profit target and stop-loss before entering. | A clear plan prevents emotional decision-making and helps manage risk systematically. | Failure to set a stop-loss can lead to substantial losses if the stock moves strongly against your position. |
This table serves as a step-by-step guide to help you apply the theory of covered puts in a structured way. By following these steps, you can execute your trades with a clear plan, focusing on managing risk and giving your strategy the best chance to succeed.
Your Next Steps To Covered Put Mastery
Moving from understanding the theory behind covered puts to confidently executing them is a major leap. Mastering this income strategy isn't about one lucky trade; it's about building a repeatable, disciplined process. This framework is what separates consistent traders from those who guess and hope. This guide will break down the key factors for success, taking you from curious beginner to confident practitioner.
Your Practical Roadmap
Before you place your first covered put trade, you need a clear plan. Professional traders don't depend on luck—they rely on systems. Your system should have built-in warning signs that tell you when to hit the pause button and rethink a trade. For instance, if a stock's implied volatility is extremely low, the premium you'd collect might not justify the risk. Likewise, a major news event like an earnings report can dramatically increase the risk of a sharp price move against you.
A crucial part of this roadmap is setting realistic goals. The aim isn't to get rich overnight but to generate steady income while carefully managing risk. Here are the core pieces to include in your trading plan:
- Account Sizing: Beginners should start with a paper trading account to practice placing trades without any financial risk. When you're ready for real money, a common recommendation for options trading is a minimum account size of $10,000. This amount typically allows for better diversification and position sizing without taking on too much leverage.
- Market Conditions: Begin by looking for stocks in stable, sideways, or slightly bearish markets. Stay away from highly volatile "meme stocks" or companies facing make-or-break events until you have more experience.
- Progressive Learning: Start with small positions, risking no more than 1-2% of your capital on any single trade. As you build confidence and a successful track record, you can consider gradually increasing your position size.
From Occasional Luck To Consistent Profit
The final step toward mastery requires a shift in mindset. You need to think like a casino, not a gambler. A casino profits from thousands of bets by relying on a small, persistent statistical edge. For a covered put trader, that edge comes from selling overpriced options and managing risk systematically.
This means tracking every trade you make—your entry and exit prices, the premium collected, and your reasoning for taking the trade. This data becomes your personal feedback loop, showing you what works and what doesn't. By making this strategy a part of a broader portfolio and avoiding putting all your eggs in one basket, you can turn occasional luck into a reliable, income-generating process.
Ready to turn theory into action with data-driven confidence? Strike Price provides real-time probability metrics for every strike, helping you balance safety and premium. Stop guessing and start trading with an edge at strikeprice.app.