Credit Spread Vs Debit Spread A Trader's Decisive Guide
If a stock moves past your strike, the option can be assigned — meaning you'll have to sell (in a call) or buy (in a put). Knowing the assignment probability ahead of time is key to managing risk.
Posted by
Related reading
A Step-by-Step Covered Calls Example for Consistent Income
Unlock consistent income with our step-by-step covered calls example. This guide breaks down the strategy, risks, and outcomes to help you trade confidently.
Long Call and Short Put The Ultimate Synthetic Stock Guide
Unlock the power of the long call and short put strategy. This guide explains how synthetic long stock works, its benefits, risks, and how to execute it.
What is a Call Spread? A Clear Guide to Bull and Bear Spreads
What is a call spread? Discover how bull and bear spreads limit risk and sharpen your options trading strategy.
When you boil it down, the difference between credit and debit spreads is all about cash flow. One pays you to take on risk, and the other costs you money to bet on a big move. Your choice really depends on a simple question: do you want to get paid for things staying relatively calm, or do you want to pay for a shot at a directional win?
The Core Difference Between Credit And Debit Spreads

The biggest split between a credit spread and a debit spread happens the second you open the trade. One puts cash directly into your account, while the other takes it out.
Think of a credit spread as selling insurance. You sell a high-premium option and then buy a cheaper one further out to act as your own insurance policy, limiting your risk. This move gives you a net credit right away. The goal? For both options to expire worthless so you can walk away and keep that initial premium as pure profit.
A debit spread, on the other hand, is a directional bet. You buy a more expensive option and sell a cheaper one to help subsidize the cost. This results in a net debit, meaning you pay to get into the trade. Here, you need the underlying stock to make a significant move in your favor, which increases the value of your spread so you can sell it for a profit.
Cash Flow and Strategy Goals
Of course, before building either of these, you need a solid grasp of understanding how to read options chains. Every piece of data you need lives right there. If you need a refresher, our guide on what option spreads are is a great place to start.
The initial cash flow really sets the tone for your entire strategy. For instance, a bear put debit spread—where you buy a $50 put and sell a $45 put—costs you money upfront. But a bull put credit spread might involve selling that same $50 put and buying the $45 put for protection, giving you an immediate cash credit.
Key Takeaway: Credit spreads are income plays. They make money from time decay and the stock not moving too dramatically against you. Debit spreads are all about direction; you need to be right about where the market is headed to profit.
Credit Spreads Vs Debit Spreads At A Glance
To make things even clearer, let's break down the foundational differences in a simple table. This gives you a quick, high-level look at their core mechanics.
| Characteristic | Credit Spread | Debit Spread |
|---|---|---|
| Initial Cash Flow | Net credit (money received) | Net debit (money paid) |
| Primary Goal | Generate income; options expire worthless | Profit from a directional price move |
| Market Bias | Neutral to moderately directional | Strongly directional (bullish or bearish) |
| Ideal Volatility | High and expected to fall | Low and expected to rise |
| Time Decay (Theta) | Works in your favor (ally) | Works against you (enemy) |
As you can see, these two strategies are essentially mirror images of each other. The one you choose depends entirely on your market outlook, your tolerance for risk, and whether you want to be a seller of time or a buyer of direction.
How Credit Spreads Generate Income

Credit spreads are a favorite for one simple reason: they put cash in your account the moment you open the trade. Unlike buying a stock and just hoping it goes up, a credit spread pays you upfront for taking on a calculated, well-defined amount of risk.
The idea is straightforward but powerful. You sell a high-premium option while simultaneously buying a cheaper, further out-of-the-money option. The one you buy is your insurance policy, capping your potential loss if the trade moves against you.
Since the premium you collect from the sold option is higher than the premium you pay for the protection, you get a net credit. This isn't just instant income; it also represents your maximum possible profit. Your goal is for both options to expire worthless so you can keep the entire amount.
The Mechanics of a Bull Put Spread
Let's make this real with a common credit spread: the Bull Put Spread. You use this strategy when your outlook is neutral to bullish—you just expect a stock to stay above a certain price.
Imagine a stock, XYZ, is trading at $105 per share. You believe it will stay above $100 for the next month. Here’s how you’d set up a bull put spread:
- Sell a put option with a $100 strike price, collecting a $2.50 premium per share.
- Buy a put option with a $95 strike price for protection, paying a $1.00 premium per share.
The net result? A credit of $1.50 per share ($2.50 - $1.00), or $150 per contract (since one contract equals 100 shares). This $150 is the most you can make on this trade.
A credit spread is really a bet that something won't happen. You profit from the stock behaving as expected while time ticks by, slowly eroding the value of the options you sold.
Calculating Your Risk and Breakeven
One of the biggest draws of a credit spread is that its risk profile is crystal clear from the start. Using our Bull Put Spread example, let’s quickly calculate the max loss and breakeven point.
Maximum Profit: This is just the net credit you received upfront. In our example, it's $1.50 per share, or $150 per contract. You get to keep all of it if XYZ closes above $100 at expiration.
Maximum Loss: This is the difference between the strike prices, minus the net credit you collected. Here, that would be ($100 - $95) - $1.50 = $3.50 per share, or $350 per contract. This loss only happens if XYZ tanks, closing at or below $95 at expiration.
Breakeven Point: This is the price where you neither make nor lose money. For a bull put spread, it's your short strike price minus the net credit: $100 - $1.50 = $98.50. As long as XYZ stays above $98.50, your trade is in the green.
Your best friend in this strategy is time decay, also known as Theta. Every day that passes, the options in your spread lose a little bit of their extrinsic value, pushing you closer to realizing that maximum profit. The strategy succeeds not through wild price swings, but through predictability and the simple passage of time.
For a more detailed look, you can walk through a complete credit put spread example with different scenarios.
How Debit Spreads Target Directional Moves
If credit spreads are a bet on what won't happen, debit spreads are the exact opposite. You're paying a small, upfront fee for the chance to cash in on a significant price move. These are purely directional plays, built for traders with a strong conviction about where a stock is headed.
The setup is a mirror image of a credit spread. You buy a more expensive option and sell a less expensive one of the same type (calls or puts) and expiration. Because the option you buy costs more than the premium you collect from the one you sell, you start with a net debit. This initial cost is the absolute most you can lose on the trade. No surprises.
This structure lets you capture a specific, anticipated move without the unlimited risk or high cost of buying a single call or put outright. Selling the cheaper option acts as a discount, making your directional bet much more capital-efficient.
A Bull Call Spread Example
Let's walk through a classic debit spread: the Bull Call Spread. You'd use this when you're bullish and expect a stock to rise—but not necessarily skyrocket.
Imagine stock ABC is trading at $52 a share. You think it has a good shot at rallying past $55 in the next month. Here’s how you could build a bull call spread:
- Buy a call option with a $55 strike, paying a $2.00 per share premium.
- Sell a call option with a $60 strike, collecting a $0.75 per share premium.
Your net cost, or debit, is the difference: $2.00 - $0.75 = $1.25 per share. For one contract (representing 100 shares), your total upfront cost and maximum risk is $125.
Debit spreads demand accuracy. It's not enough to be right on the direction. The stock has to move far enough, fast enough, to outrun your initial cost and the daily tick-tock of time decay.
Calculating Profit Potential and Breakeven
With a debit spread, your profit and loss are locked in from day one, which makes risk management incredibly straightforward. The trade's success boils down to whether the stock can get past your breakeven point.
Let’s run the numbers for our ABC trade:
Maximum Profit: Your max gain is the difference between the strike prices, minus the debit you paid. Here, that's ($60 - $55) - $1.25 = $3.75 per share, or $375 on the contract. You hit this profit target if ABC closes at or above $60 by expiration.
Maximum Loss: It’s simply the net debit you paid to get in. In this case, $1.25 per share, or $125 total. This happens if ABC finishes at or below your long strike of $55 when the options expire.
Breakeven Point: This is the magic number the stock needs to pass for you to start making money. For a bull call spread, just add the debit to your long strike: $55 + $1.25 = $56.25.
Unlike credit spreads where time is your friend, time decay (Theta) is actively working against a debit spread. Every single day the stock doesn't move in your favor, your position bleeds a little value. This makes timing everything. The move you predicted needs to happen before time decay eats away your potential gains—a crucial difference to remember when weighing a credit spread vs debit spread.
Comparing Risk Reward And Profit Probability
The real debate between credit and debit spreads boils down to a classic trade-off: risk, reward, and the probability of being right. Each strategy is built on a totally different philosophy. Picking the right one means knowing which side of that equation you want to be on for a particular trade.
Credit spreads are designed to be high-probability plays. When you sell an option spread, you collect cash upfront and win as long as the stock doesn't make a big, aggressive move against you. Your profit is capped at that initial credit, but your chance of keeping it is often quite high—think 70% or more.
Debit spreads, on the other hand, are structured for a much better reward-to-risk ratio. You pay a small cost upfront for a shot at a much bigger payout. These are directional bets. They need the stock to move a certain way to make money, which naturally lowers their probability of success. It's a simple choice: aim for a bigger prize with a smaller chance of winning it.
The Asymmetry of Risk and Reward
The core difference is how each strategy handles risk. A credit spread gives you a small potential reward for a high chance of success, but the maximum potential loss is almost always significantly larger than your maximum gain. This is why managing your position size is absolutely critical.
Debit spreads completely flip this around. Your max loss is capped at the small debit you paid to enter the trade, while your max profit can be several times larger. A debit spread might give you a 40% chance of a 200% return, while a credit spread might offer a 70% chance of a 25% return. It all depends on whether you prefer stacking up small, consistent wins or holding out for less frequent but much larger gains.
This visual shows the key parts of a Bull Call Spread, a common debit strategy, illustrating how your risk, breakeven, and profit are all defined from the get-go.
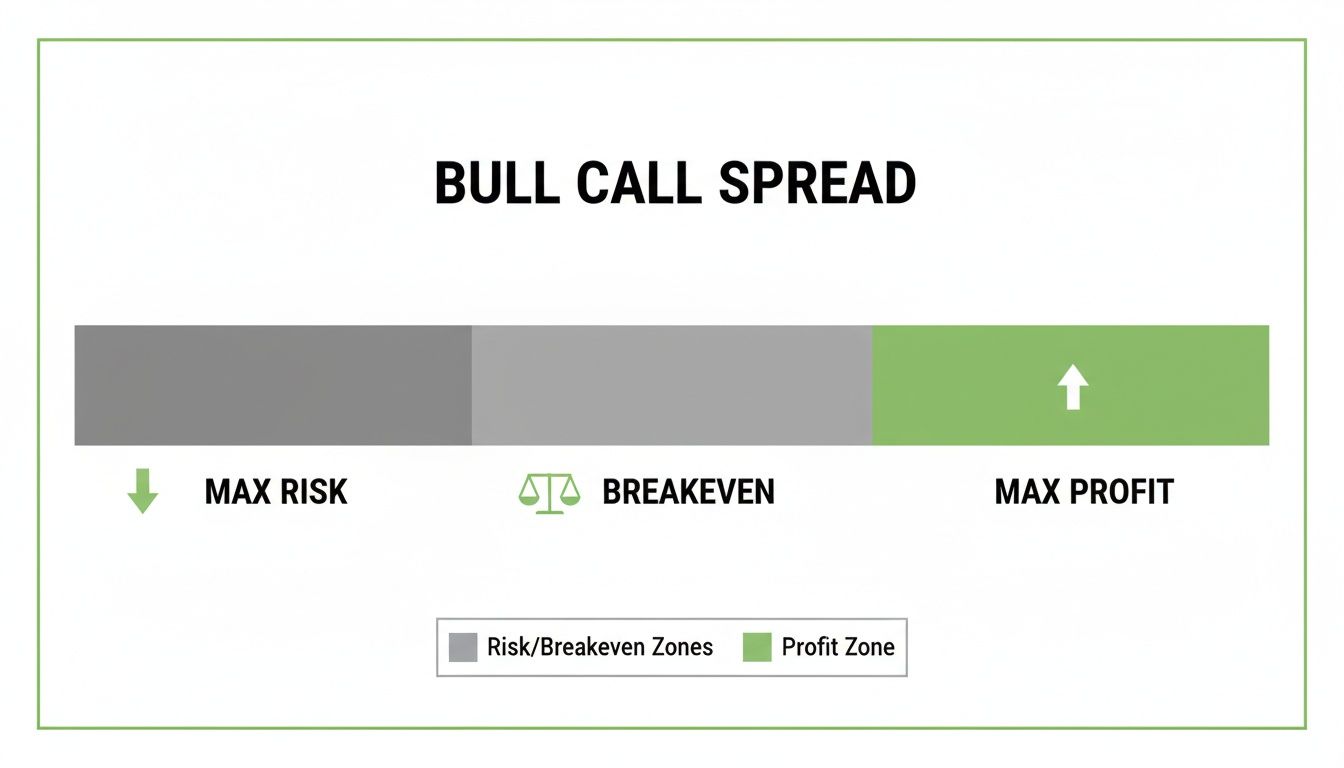
As you can see, the upfront debit defines your maximum risk. The potential profit is determined by the distance between your strike prices, making the reward-to-risk ratio look very attractive if your directional bet pays off.
A Data-Driven Look at Win Rates
That risk-reward asymmetry makes debit spreads tempting for aggressive traders, but their higher breakeven points often mean lower win rates. Looking at data from 2022, debit spreads averaged around a 45% win rate, compared to 55-65% for credit spreads. A debit spread might need the stock to rally 5% just to break even, whereas a credit spread might only need the stock to stay above a price just 1.65% below where it is now.
Key Insight: Credit spreads are about selling time and probability. Debit spreads are about buying direction and potential. Your strategy should line up with how strong your conviction is.
To really get this right, traders lean on tools to analyze these probabilities in real-time. Knowing the likelihood of a stock touching or expiring past your strike price is essential. Our guide on using an option probability calculator takes a deeper dive into how these metrics can sharpen your strategy selection.
Practical Implications for Your Trading
So, what does this all mean for your next trade?
For Income Generation: If your goal is to grind out consistent, smaller returns and you have a neutral or mildly directional view, the high probability of a credit spread is your best friend. You're basically getting paid to bet that the market will stay relatively calm.
For Directional Conviction: If you have a strong gut feeling that a stock is about to make a big move and you want to maximize your return on that call, a debit spread offers a much better reward-to-risk profile. You accept a lower chance of success in exchange for a much bigger potential payday.
Ultimately, choosing between a credit and debit spread isn't about which one is "better" in a vacuum, but which one is better for the situation right in front of you. It requires an honest look at your market forecast, your stomach for risk, and what you’re trying to achieve.
Choosing Your Strategy Based On Market Conditions
Once you get the hang of the mechanics, the real art of trading spreads comes down to picking the right tool for the job. And more often than not, that decision hinges on one critical factor: implied volatility (IV).
Think of IV as the market's collective guess on how much a stock is going to swing in the future. High IV means the market is expecting fireworks—so option prices get expensive. Low IV means things are calm, and option prices are cheap. Your job is to figure out which side of that pricing you want to be on.
When High Implied Volatility Favors Credit Spreads
High-IV environments are a credit spread seller’s dream. Think about the days leading up to an earnings report or a big FDA announcement. Uncertainty is through the roof, and that fear gets baked directly into option premiums, making them incredibly rich.
Selling a credit spread here means you collect a much larger upfront payment for taking on the same amount of risk. This inflated premium gives you two huge advantages:
- More Income: A bigger credit means a bigger potential profit. Simple as that.
- A Wider Safety Net: That extra credit pushes your breakeven point further away, giving your trade more room to be wrong before it turns into a loss.
For example, selling a bull put spread on a volatile tech stock right before earnings will net you a much fatter premium than doing it on a quiet Tuesday. You're getting paid top dollar to bet that the post-earnings drop won't be as bad as the market is pricing in. After the news hits, that uncertainty vanishes, volatility collapses (a phenomenon known as "IV crush"), and the options you sold lose value fast—letting you lock in your profit.
Key Takeaway: High IV means options are expensive. As a seller, you want to sell things when they’re overpriced. That makes credit spreads the go-to strategy when IV is jacked up.
Why Low Implied Volatility Is Ideal For Debit Spreads
On the flip side, when implied volatility is low, options are on sale. This is the perfect time to be a buyer and put on a debit spread.
Since your max risk is the upfront cost—the net debit—it just makes sense to enter the trade when that cost is as low as possible. A cheaper entry not only limits your potential loss but also juices your potential return on the capital you put up.
A debit spread is really a bet on two things: getting the direction right and seeing volatility pick up. If you buy a bull call spread when IV is snoozing and the stock starts to rally, you win twice. First, the stock's upward move helps you (that's Delta). Second, a rally often wakes up implied volatility (that's Vega), which pumps up the value of the option you bought even more.
This isn't just theory; it's a data-driven edge. Some of the sharpest traders I know have clear rules for this. They'll look at buying debit spreads when a stock's IV is in the lower half (say, the 0-50th percentile) of its 52-week range. Conversely, they start hunting for credit spreads when IV climbs above that 50th percentile mark and looks like it's ready to fall.
As you can see how blending these strategies can work, letting the market's volatility tell you which playbook to run is a cornerstone of consistent trading.
Common Questions Answered
When you're weighing a credit spread against a debit spread, a few practical questions always come up. Getting these right can be the difference between a confident trade and a costly one.
What's the Real Risk with a Credit Spread?
The biggest thing to watch out for with a credit spread is assignment risk on the option you sold (your short leg). This becomes a real possibility if the stock price blows past your short strike, pushing the option in-the-money. When that happens, the person who bought it can exercise their right, forcing you to buy or sell the stock at the strike price.
Sure, your long option is there to protect you from a catastrophic loss, but an early assignment can still throw a wrench in your plans. It might force you to close the whole trade earlier than you wanted, sometimes for a loss. That's why one of the most important risk management moves is to close your position well before expiration, especially if that short leg starts looking threatened.
When Should I Use a Debit Spread Instead of Just Buying an Option?
A debit spread is your go-to when you're expecting a moderate move in one direction. While buying a single call or put gives you that lottery-ticket-style unlimited profit potential, it's also a lot more expensive and gets eaten away by time decay (Theta) every single day.
A debit spread slashes your upfront cost because the option you sell helps pay for the option you buy. This lowers your maximum loss and brings your breakeven point closer, making it a much more capital-efficient way to play a directional move without needing the stock to shoot for the moon just to turn a profit.
Think of a debit spread as a trade-off. You're capping your potential profit, but in return, you get a much lower cost of entry and a better shot at breaking even compared to just buying a naked option.
How Do I Handle a Spread Trade That's Going Against Me?
Managing a losing trade really depends on which type of spread you're in. The game plan is completely different for each.
For Debit Spreads: Your max loss is capped at the small premium you paid to get in. Because of this, the most common approach is simply to let it expire worthless if the trade doesn't pan out. It’s often not worth the extra commissions to try and manage it on the way down.
For Credit Spreads: Here, your potential loss is much larger than your potential gain, so you have to be more hands-on. If the stock starts moving against you, a popular technique is to “roll” the position. This means closing your current spread and opening a new one further out in time. This move often brings in another credit, giving your trade more time to be right and sometimes even improving your breakeven price.
Ready to stop guessing and start making data-driven decisions? Strike Price gives you real-time probability metrics for every strike, so you can pick the right spread for any market. Find high-reward opportunities and get smart risk alerts to protect your profits. Learn more at Strike Price.