How to Calculate Break Even Price for Your Business
If a stock moves past your strike, the option can be assigned — meaning you'll have to sell (in a call) or buy (in a put). Knowing the assignment probability ahead of time is key to managing risk.
Posted by
Related reading
A Step-by-Step Covered Calls Example for Consistent Income
Unlock consistent income with our step-by-step covered calls example. This guide breaks down the strategy, risks, and outcomes to help you trade confidently.
Long Call and Short Put The Ultimate Synthetic Stock Guide
Unlock the power of the long call and short put strategy. This guide explains how synthetic long stock works, its benefits, risks, and how to execute it.
What is a Call Spread? A Clear Guide to Bull and Bear Spreads
What is a call spread? Discover how bull and bear spreads limit risk and sharpen your options trading strategy.
Calculating your break-even price is pretty simple on the surface: just divide your total fixed costs by your selling price per unit minus your variable costs per unit. That one number tells you the absolute minimum you need to sell your product for—or how many units you need to move—just to cover your expenses. It's the ultimate financial baseline.
What Your Break-Even Price Actually Tells You
Before we get into the nuts and bolts of the formula, let's talk about what this number really means. It’s way more than just a figure on a spreadsheet; it’s the financial tipping point for your business or investment. This is the exact moment where your total revenue equals your total costs, meaning you're not making a profit, but you're not losing money either. For any business, whether it's a local coffee shop or a software startup, this is your reality check.
Once you know how to calculate your break-even price, you can start making smarter decisions and asking the right questions:
- Is my current pricing actually sustainable?
- How many sales do I need to hit before I’m in the black?
- Can I afford to run this discount promotion without bleeding cash?
- What happens to my bottom line if I add a new fixed expense, like rent or another salary?
The break-even point isn't just an accounting term; it's your operational baseline. Knowing this number empowers you to set realistic sales targets and build a pricing strategy that ensures long-term profitability.
At its core, the break-even formula connects your fixed costs, variable costs, and selling price. Let's say your business has fixed costs of $10,000 a month. You sell a product for $100, and each one costs you $20 in materials and labor (your variable cost). Your contribution margin is $80 per unit.
Just divide the fixed costs ($10,000) by that contribution margin ($80), and you'll see you need to sell 125 units just to break even. If you want to dig deeper into the math, WallStreetPrep.com has a great breakdown of the break-even point formula.
Core Components of the Break-Even Calculation
To get started, you'll need to pull together a few key pieces of financial data. Think of them as the ingredients for your calculation.
The table below breaks down what you need and what each component actually represents.
| Component | Description | Example |
|---|---|---|
| Fixed Costs | Expenses that stay the same no matter how much you sell. | Rent, salaries, insurance, software subscriptions. |
| Variable Costs | Costs that go up or down directly with your sales volume. | Raw materials, shipping fees, sales commissions. |
| Selling Price Per Unit | The retail price you charge for one item or service. | The $4.50 you charge for a latte. |
Once you've got these three numbers nailed down, you have everything you need to find your break-even point and start making more strategic business decisions.
Breaking Down the Core Break-Even Formula
Ready to dive into the numbers? The formula for finding your break-even price is surprisingly simple, yet incredibly powerful. At its core, it’s all about figuring out where your costs meet your revenue.
Here’s the classic formula you’ll see in business textbooks:
Break-Even Point (in units) = Fixed Costs / (Selling Price per Unit – Variable Costs per Unit)
This isn't just some abstract equation; it’s a practical roadmap that tells you exactly what it takes to get into the black. Let's pull apart each piece so you know what you're working with.
First up, you have your Fixed Costs. These are the bills you have to pay every single month, no matter what. Think rent for your office, employee salaries, or that software subscription you can't live without. They stay the same whether you sell one widget or a thousand.
Then come the Variable Costs. These are the expenses tied directly to what you produce. For every new item you make or service you offer, these costs go up. This includes things like raw materials, packaging, and shipping fees.
The Power of the Contribution Margin
Now, the most interesting part of that formula is what’s inside the parentheses: (Selling Price – Variable Costs). This little number has a big name: the contribution margin.
Essentially, it's the amount of cash from each sale that's left over to "contribute" to paying off your fixed costs. Once those fixed costs are covered by the contribution margins from all your sales, every dollar you make from that point on is pure profit.
This concept is just as critical in the world of options trading. Understanding how to calculate an option premium is similar—it helps you figure out your financial cushion on a trade.
Let’s run through a quick example. Imagine a company that makes high-end water bottles. Their annual fixed costs for things like the factory lease and admin salaries total $100,000. It costs them $2 in materials to make each bottle, and they sell for $12.
- Contribution Margin: $12 (Price) - $2 (Variable Cost) = $10 per bottle
- Break-Even Point: $100,000 (Fixed Costs) / $10 (Contribution Margin) = 10,000 units
This means the company has to sell exactly 10,000 water bottles just to cover its costs. The 10,001st bottle they sell is where the profit begins. If you want to dig even deeper into this, the Corporate Finance Institute has some great resources on break-even analysis.
Applying the Formula to Products and Services

The core break-even formula is a fantastic tool, but you have to know how to apply it. The cost structure for a t-shirt brand looks nothing like that of a marketing consultant, and that’s okay. The key is correctly identifying your "unit" of sale.
For anyone selling physical products, the unit is pretty straightforward—it’s the item itself. Let's take a simple e-commerce store selling graphic tees.
- Fixed Costs: $3,000/month (website hosting, software, marketing).
- Variable Cost per Shirt: $10 (blank shirt, printing, packaging).
- Selling Price: $25 per shirt.
Here, the contribution margin is $15 ($25 - $10). To find the break-even point in units, we just run the numbers: $3,000 / $15 = 200 shirts. That means the store has to sell 200 shirts every single month just to cover its baseline costs.
How to Calculate Break-Even Price for Services
Now, what if you're selling a service? Your most valuable inventory is your time. For a freelance consultant, the "unit" becomes an hour of billable work.
Imagine a consultant with $2,000 in monthly fixed costs—think business insurance, software, and a co-working space. They plan to work about 100 billable hours per month.
To figure out their break-even hourly rate, we just divide the fixed costs by the billable hours: $2,000 / 100 hours = $20 per hour. This $20 is the absolute floor. It's the baseline cost of their time before a single cent of profit is made. Any real earning has to come from a billing rate significantly higher than that.
For businesses juggling a huge, diverse inventory, calculating a break-even point for every single item is a nightmare. A much smarter approach is to calculate the break-even point in sales dollars to get a clear, overall target.
This distinction is vital. It’s no secret that many small businesses fail because they have a poor grasp of their own profit thresholds. Financial clarity isn't just a "nice to have"—it's a core factor in survival.
Once you’ve got a handle on the break-even point for your offerings, you can take your analysis a step further. The next move is to master margin calculations in Excel, which helps you really drill down into your profitability.
Calculating Break Even Prices in Options Trading
When you shift from running a business to trading options, the whole idea of "breaking even" takes on a new meaning. For a trader, it’s not about covering overhead costs; it’s about pinpointing the exact stock price where a trade stops losing money and starts becoming profitable at expiration. Nailing this calculation is fundamental to managing your risk.
Let's look at a couple of common strategies where this comes into play.
The Covered Call Scenario
With a covered call, you own the underlying stock and sell a call option against it. The main goal here is to pocket the premium as income. Ideally, you want the stock to hang out below the strike price, but the premium you collected gives you a nice cushion if the stock price drops.
The formula couldn't be simpler:
Stock Purchase Price - Premium Received = Break Even Price
Say you bought 100 shares of XYZ at $50 a pop. You then sell a call option and collect a $2 premium per share. Your break-even price is now $48. That $2 premium acts as a buffer, meaning the stock has to fall below $48 before your position is actually in the red.
The Protective Put Strategy
A protective put is basically insurance for a stock you own. You buy a put option to protect yourself against a potential nosedive in the stock's price. This gives you the right to sell your shares at the strike price, no matter how low the stock goes, putting a floor under your potential losses. Of course, this insurance isn't free—the cost is the premium you pay.
Here’s how you figure out the break-even for this position:
Stock Purchase Price + Premium Paid = Break Even Price
Imagine you own 100 shares of ABC stock that you bought at $100. Worried about a drop, you buy a protective put with a $95 strike price, paying a $3 premium per share for it. Your break-even point on the entire position moves up to $103 ($100 purchase price + $3 premium). The stock now has to climb all the way to $103 just for you to cover the cost of that "insurance" and break even.
This visual really helps break down how all the different costs add up to that final break-even number.
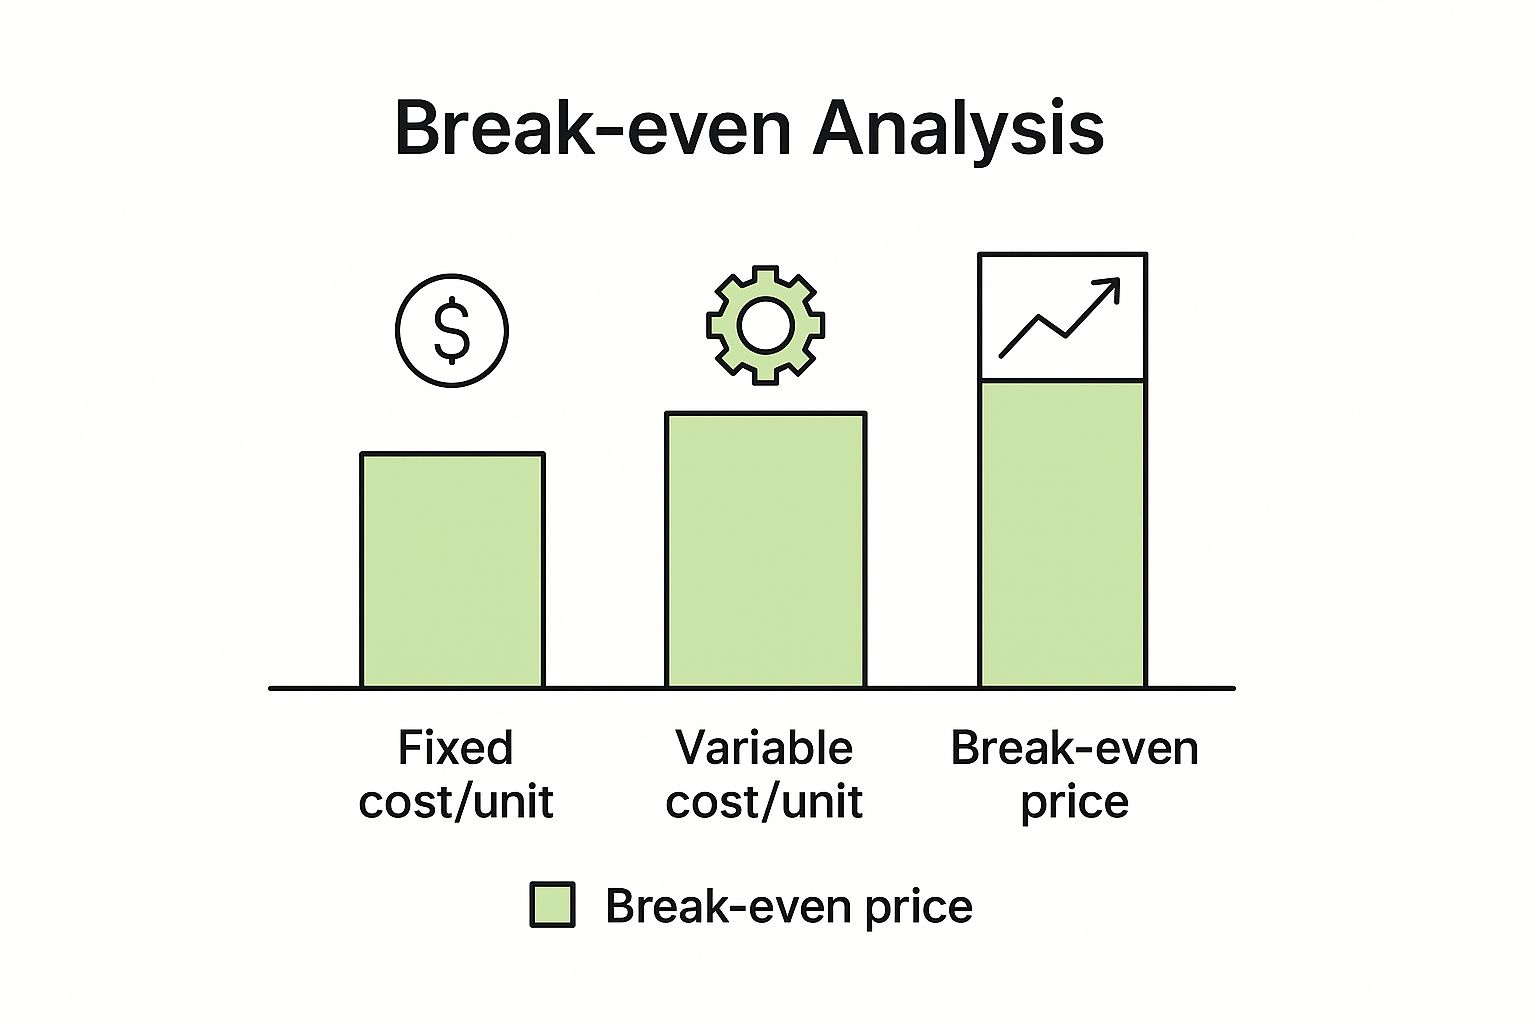
As you can see, the break-even price is simply the point where you've covered all your costs. Only after you cross that line does a trade start making you money.
In options trading, your break even isn't just a number—it's your strategic line in the sand. It tells you precisely where a trade transitions from costing you money to making you money, which is essential for managing your portfolio's risk.
Comparing Break Even Formulas for Calls and Puts
When you're buying a standalone call or put option (not as part of a covered or protective strategy), the calculation is slightly different but just as crucial. Here's a quick side-by-side look.
| Option Type | Break Even Formula | Example Scenario |
|---|---|---|
| Buying a Call | Strike Price + Premium Paid | You buy a $50 strike call for a $2 premium. The stock must rise to $52 for you to break even. |
| Buying a Put | Strike Price - Premium Paid | You buy a $50 strike put for a $2 premium. The stock must fall to $48 for you to break even. |
Knowing these simple formulas by heart is non-negotiable for any options trader. They form the basis of your risk assessment for every trade.
Going a step further, it’s not just about where you break even. To get a fuller picture, it helps to calculate expected value, which gives you a sense of a trade's potential profitability over the long run.
And don't forget about volatility! It's a massive factor in how options are priced. Our guide on how to calculate implied volatility is a great next step for understanding how market expectations can impact your trades. These tools help you move from making guesses to making informed decisions.
Turning Break Even Analysis into a Strategic Advantage

Knowing how to find your break-even price is just the starting line. The real magic happens when you use that number to make smarter, more confident decisions. Think of it less as a static number and more as a dynamic tool for planning and managing risk.
This isn't just about covering your costs. Your break-even analysis should be a core part of your pricing strategy, helping you land on that sweet spot between staying competitive and actually being profitable. Thinking about bringing on a new team member? Run the numbers. You’ll see exactly how much more revenue you need to cover their salary, turning a gut-feeling decision into a data-backed one.
Running What-If Scenarios for Proactive Management
The true power of this analysis comes from its ability to predict the impact of future changes. Don't just react to market shifts—get ahead of them. By running a few simple "what-if" scenarios, you can stay ahead of the curve.
Here are a few ways I’ve seen this play out:
- Cost Increases: What happens to your break-even point if your raw material costs suddenly jump by 15%? Answering that question now helps you decide whether to absorb the hit, hunt for a new supplier, or tweak your pricing.
- New Investments: Is that shiny new piece of equipment really affordable? Your break-even calculation will tell you the exact sales volume required to justify the expense.
- Promotional Planning: If you run a discount, how many more units do you need to sell just to make the same profit as before? This simple check prevents a well-intentioned promotion from accidentally wrecking your bottom line.
Your break-even point is a crucial financial benchmark. Use it to stress-test your business model against potential challenges and opportunities, turning reactive panic into proactive strategy.
This kind of forward-thinking is the bedrock of a resilient business. It’s also a core principle of successful investing, where proactive analysis is everything. In fact, many of these concepts are fundamental to effective options risk management strategies that help shield a portfolio from market surprises. By actively modeling different outcomes, you can prepare your business for whatever comes next.
Common Questions About Break Even Price
When you start digging into financial metrics, it's natural to have a few questions pop up. That's a good thing. Getting comfortable with the break-even price isn't just about plugging numbers into a formula; it's about understanding the why behind it and how it fits into your bigger financial picture. Let's tackle a couple of the most common points of confusion.
A question I hear all the time is about the difference between the break-even point and the payback period. They sound related, but they're measuring two completely different things. Think of it this way: the break-even point tells you how many widgets you need to sell to cover your costs. The payback period tells you how long it'll take for an investment to pay for itself.
Keeping Your Numbers Fresh
Another big one is, "How often should I run a break-even analysis?" The short answer: whenever something important changes. This isn't a "set it and forget it" calculation. You absolutely need to recalculate if:
- Your fixed costs change. Did your rent go up? Did you hire a new salaried employee? Time to rerun the numbers.
- Your variable costs shift. Maybe your main supplier just jacked up their prices. That directly impacts your break-even.
- You change your pricing. This is a huge one. Any price adjustment, up or down, changes your contribution margin and, therefore, your break-even point.
Staying on top of this keeps your analysis from becoming stale and useless. Let’s say you run a big promotion that lowers your selling price. You have to know how many more units you suddenly need to sell just to avoid turning that sales bump into a net loss.
Reaching your break-even point isn't the finish line—it's the starting line for profitability. The real goal is to blow past it, not just scrape by. Just breaking even means you're surviving, not thriving.
At the end of the day, the break-even calculation is a health check for your business. It shines a light on your operational efficiency and financial stability. If you're consistently falling short of your break-even point, that's a massive red flag that something in your cost structure or pricing strategy needs a hard look, right now. Use it as a guidepost for growth, not just a measure of survival.
Ready to stop guessing and start making data-driven decisions? Strike Price gives you real-time probability metrics for every strike price, so you can trade your covered calls and secured puts with confidence. Find your edge today at https://strikeprice.app.