How to Calculate Option Profit The Right Way
If a stock moves past your strike, the option can be assigned — meaning you'll have to sell (in a call) or buy (in a put). Knowing the assignment probability ahead of time is key to managing risk.
Posted by
Related reading
A Step-by-Step Covered Calls Example for Consistent Income
Unlock consistent income with our step-by-step covered calls example. This guide breaks down the strategy, risks, and outcomes to help you trade confidently.
Long Call and Short Put The Ultimate Synthetic Stock Guide
Unlock the power of the long call and short put strategy. This guide explains how synthetic long stock works, its benefits, risks, and how to execute it.
What is a Call Spread? A Clear Guide to Bull and Bear Spreads
What is a call spread? Discover how bull and bear spreads limit risk and sharpen your options trading strategy.
Calculating your profit from an options trade is pretty straightforward. At its core, you're just finding the difference between what you paid (or got paid) for the contract and what it's worth when you close the position. For a long call, your profit is the final stock price minus the strike price, and then you subtract the premium you paid. For a long put, it’s the strike price minus the stock price, minus your premium.
Your Quick Guide to Option Profit Formulas
To get a real handle on your potential gains or losses, you need to know the core formulas by heart. These simple calculations are the bedrock of any solid options strategy, taking you from just guessing to making decisions backed by actual numbers.
The initial cost you paid for the option, called the premium, is a huge piece of the puzzle. If you want a deeper dive into what makes up that cost, check out our detailed guide on how to calculate option premium.
Getting comfortable with these formulas lets you quickly size up a trade before you put any money on the line. More importantly, it helps you find your exact break-even point—the price the stock needs to hit for you to start making money.
Key Takeaway: Your net profit isn't just about whether the stock moved in your favor. It's about whether it moved enough to overcome the initial premium you paid for the contract.
Core Profit Calculation Formulas
Here's a quick reference table with the essential formulas for calculating your profit on basic long calls and puts at expiration. Think of it as your go-to cheat sheet for quick assessments.
| Option Type | Profit Formula |
|---|---|
| Long Call | (Underlying Price - Strike Price) - Premium Paid |
| Long Put | (Strike Price - Underlying Price) - Premium Paid |
Keep these handy. Whether you're planning a new trade or reviewing an old one, they provide the clarity you need to understand exactly where your money is going.
What Drives Your Profit in an Options Trade?

Before you can nail down your profit on an options trade, you have to know what ingredients are in the mix. It's not as simple as watching the stock price go up or down. A few key forces—the premium, the strike price, and the stock's market price—are constantly interacting to determine your outcome.
For an options buyer, the upside is technically infinite, but your risk is locked in—you can only lose the premium you paid. For a seller, it's the opposite. Your profit is capped at the premium you collected upfront, but your potential losses can be much, much larger if the trade goes south.
The Core Components of Profit
At its heart, options profit is about the relationship between what you paid for the contract and what it’s worth compared to the strike price when you exit.
Let's say you buy a call option with a $100 strike price for a $5 premium. For you to actually make money, the stock needs to climb past $105 by the time the option expires. Anything less, and you're either breaking even or losing money.
This basic math is the starting point, but traders who do this for a living go much deeper to manage their risk and fine-tune their predictions.
Institutional investors and serious retail traders rely on detailed historical data, analyzing options prices and risk metrics known as "the Greeks" to backtest strategies and optimize their approach to profitability. You can learn more about how professionals use this data at OptionMetrics.
Beyond the Basics: Enter the Greeks
To really understand what makes your profit tick, you need to look at how sensitive your option is to changes in the market. This is where the "Greeks" come in. They're a set of risk metrics that give you a much clearer picture.
Here are two of the most important ones:
- Delta: This tells you how much your option's price is expected to change for every $1 move in the underlying stock's price. It's a quick way to gauge directional risk.
- Theta: You'll often hear this called "time decay." It shows how much value an option loses every single day as it gets closer to expiring. It’s a constant headwind for option buyers.
Getting a handle on variables like these is what separates simple guesswork from strategic trading. If you want to see how different market conditions could impact your trade's outcome, it's a good idea to learn how to perform sensitivity analysis. This helps you move from basic calculations to truly forecasting your potential profit.
Building Your Profit Calculation Toolkit

Let's be honest: relying on mental math when real money is on the line is just asking for trouble. To get a real handle on your options profit, you need a reliable system—whether that's a dedicated options calculator or a simple but powerful spreadsheet you build yourself.
The whole point is to move beyond one-off calculations and create a repeatable process. Your toolkit should let you run quick scenarios, showing you exactly how different outcomes might affect your bottom line before you ever place a trade.
Setting Up Your System
A basic spreadsheet is a fantastic place to start. All you need to do is create dedicated input fields for the essential variables of any trade. This setup allows you to plug in the numbers and instantly see the potential profit or loss.
Your core inputs should include:
- Strike Price: The price at which the option can be exercised.
- Premium Paid/Received: The total cost of the option contract.
- Number of Contracts: How many options you're trading (and don't forget, each one usually controls 100 shares).
- Projected Underlying Price at Expiration: Your best guess for where the stock will land.
Once these fields are in place, you can build formulas to automate all the math. To really step up your game, you could even bring in a more robust tool like a dedicated profit and loss analyzer.
The options market moves fast, and it can be unforgiving. One study found that retail traders lost around $2 billion in premiums between 2019 and 2021 alone. This is exactly why having a precise toolkit isn't just a nice-to-have; it's absolutely essential for managing your risk.
For a more dynamic analysis, some traders integrate real-time data feeds or use platform APIs to keep their spreadsheets updated automatically. This can also help you track how other variables, like an option's Delta, are shifting over time. If you need a refresher on that key metric, check out our guide on what Delta is in options trading.
Profit Calculations in Real-World Scenarios
Theory is one thing, but running the numbers on actual trades is where it all starts to click. Let's walk through two common scenarios—one bullish and one bearish—to see exactly how the profit formulas play out.
Example 1: The Bullish Call Option
Let's say you're bullish on Company XYZ, which is currently trading at $48 a share. You think it's heading higher, so you buy one call option contract with a $50 strike price that expires in a month. The premium for this contract costs you $2 per share.
Since one options contract controls 100 shares, your total upfront cost is $200 ($2 premium x 100 shares). No matter what happens, that $200 is the absolute most you can lose on this trade.
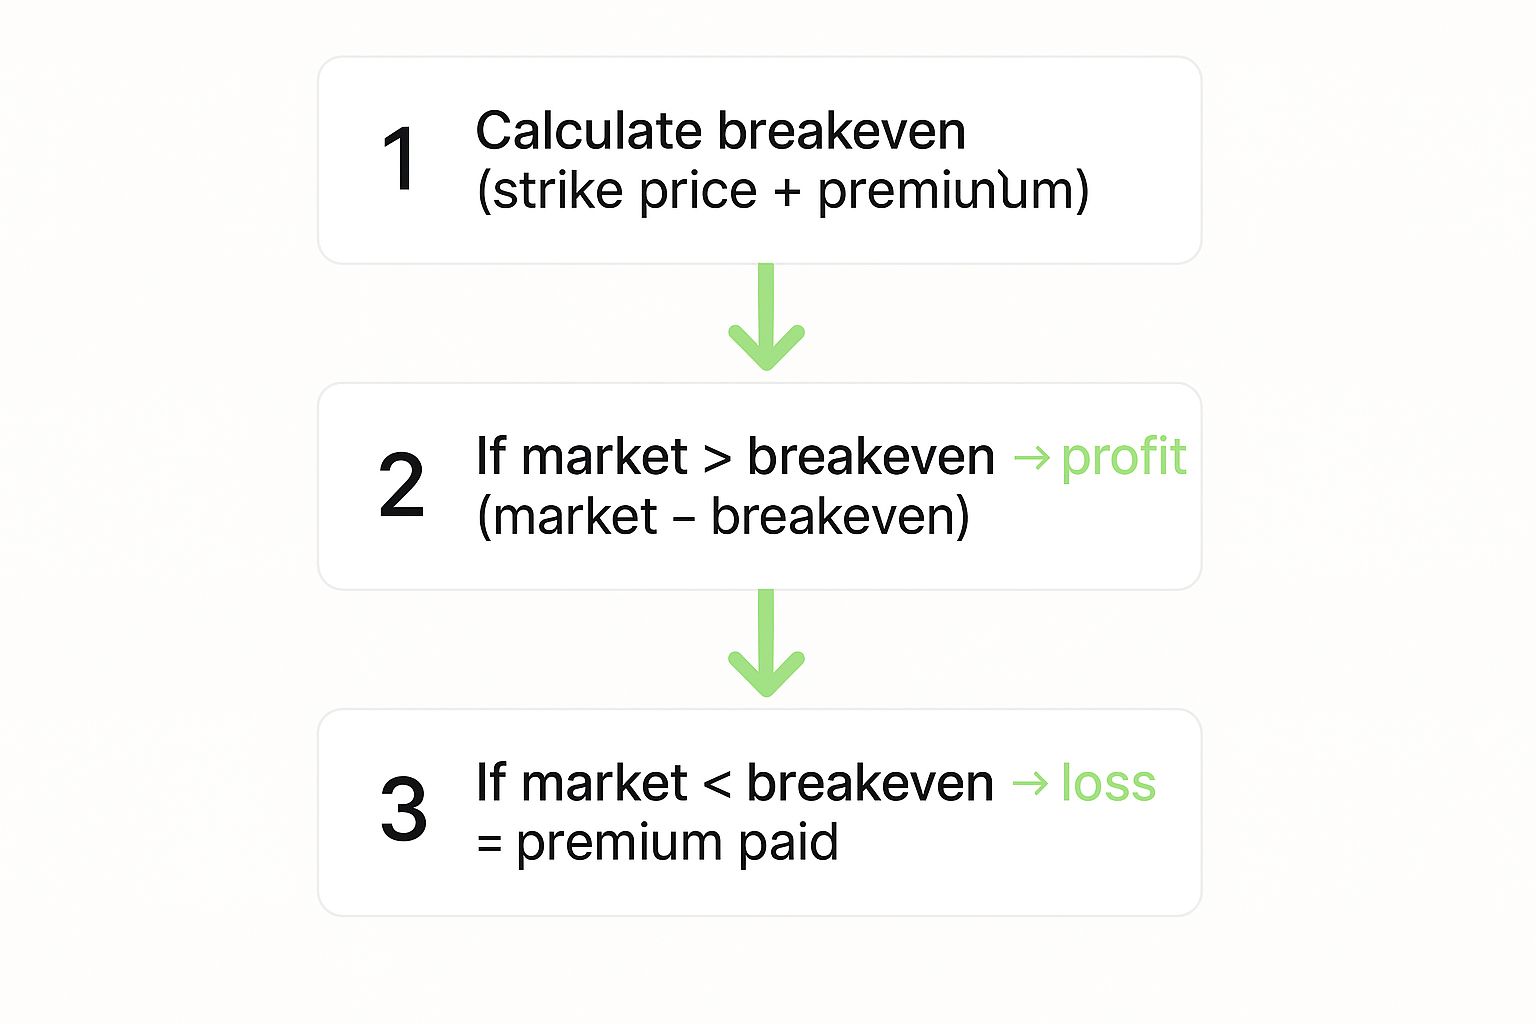
Your break-even price is where you cross from loss to profit. For a call option, you just add the premium to the strike price:
$50 (Strike Price) + $2 (Premium) = $52 (Break-Even Price)
Now, let's fast forward. Your prediction was spot on, and at expiration, XYZ is trading at $55 per share. Because the stock price is above your $50 strike, the option is "in-the-money" and has real value.
Here's the breakdown:
- Gross Profit Per Share: $55 (Market Price) - $50 (Strike Price) = $5
- Net Profit Per Share: $5 (Gross Profit) - $2 (Premium Paid) = $3
- Total Net Profit: $3 (Net Profit Per Share) x 100 Shares = $300
This handy visual breaks down how your profit (or loss) is determined.
As you can see, you only start making money once the stock price moves past the break-even point, which covers both your strike price and the initial premium you paid.
Example 2: The Bearish Put Option
Okay, let's flip the script. Now you're bearish on Company ABC, which is trading at $97. You expect it to fall, so you buy one put option with a $95 strike price for a $3 premium.
Again, your total cost is $300 ($3 premium x 100 shares).
For a put option, the break-even math is a little different. You subtract the premium from the strike price:
$95 (Strike Price) - $3 (Premium) = $92 (Break-Even Price)
So, the stock needs to drop below $92 for you to turn a profit.
Let's say the stock does fall and hits $88 by expiration.
- Gross Profit Per Share: $95 (Strike Price) - $88 (Market Price) = $7
- Net Profit Per Share: $7 (Gross Profit) - $3 (Premium Paid) = $4
- Total Net Profit: $4 (Net Profit Per Share) x 100 Shares = $400
These scenarios illustrate how profit and loss can play out in common options trades.
Call and Put Option Profit Scenarios
The table below provides a quick-glance breakdown of potential outcomes for both call and put options based on where the underlying stock price lands at expiration.
| Option Type | Underlying At Expiry | Strike Price | Premium Paid | Profit/Loss |
|---|---|---|---|---|
| Call | $55 | $50 | $2 | $300 Profit |
| Call | $52 | $50 | $2 | $0 Breakeven |
| Call | $48 | $50 | $2 | $200 Loss |
| Put | $88 | $95 | $3 | $400 Profit |
| Put | $92 | $95 | $3 | $0 Breakeven |
| Put | $97 | $95 | $3 | $300 Loss |
Getting comfortable with these calculations is a crucial first step. Once this feels natural, you can dig into more advanced concepts, like learning how to calculate intrinsic value, to better gauge an option's true worth before it expires.
Let Your Trading Platform Do the Heavy Lifting
While doing the math by hand is a great way to learn the ropes, it’s not how you’ll trade day-to-day. Let's be real—nobody has time for spreadsheets when the market is moving.
The good news is that your trading platform already has all the tools you need to figure this out. These aren't just simple calculators; they're powerful features that help you visualize exactly what could happen with a trade, taking the guesswork out of the equation.
Finding the Profit and Loss Calculator
Most modern brokerages build a Profit/Loss (P/L) calculator right into the options chain or trade ticket. When you click on an option, you’ll often see a "payoff diagram" or a risk profile graph pop up. This is your best friend.
This visual tool instantly shows your potential profit or loss at different stock prices when the option expires. You can plug in a potential trade—like buying a call on XYZ stock—and the graph will immediately map out your break-even point, your maximum possible loss (which is the premium you paid), and where your profits start to take off.
The real magic of these tools is their ability to "stress-test" your ideas. You can play with variables like implied volatility or even jump forward in time to see how your P/L might look before the expiration date. It's like getting a sneak peek of your trade's future.
Get Realistic Estimates with Live Data
These platform tools are wired directly into live market data, which makes their calculations incredibly sharp. The constant buying and selling on major exchanges, like the Cboe exchange, creates a firehose of information that platforms use to model your trade's potential.
To really get the hang of it, make these features part of your pre-trade routine:
- Check the Payoff Graph: Before you even think about hitting the "buy" button, look at the risk profile. It gives you a crystal-clear picture of your best- and worst-case scenarios.
- Slide the Timeline: Drag the analysis date forward a few days or weeks. This shows you the real-world impact of time decay (Theta) on your option's value.
- Tweak the Volatility: What happens if volatility spikes or collapses? Adjust the implied volatility slider to see how it could supercharge your profits or turn a winning trade into a loser.
By making this a habit, you stop guessing and start making data-driven decisions. It turns a theoretical math problem into a practical part of your everyday trading strategy.
Don't Let These Simple Mistakes Derail Your Profit Calculations
Knowing the formulas is a great start, but it's the small, easy-to-miss errors that can really throw off your profit and loss numbers. Trust me, I've seen traders get tripped up by these little oversights time and time again, turning what they thought was a winner into a dud.
One of the biggest culprits? Forgetting to factor in commissions and fees. It's easy to just look at the premium you collected, but those trading costs eat directly into your bottom line. They might seem small on a single trade, but they absolutely add up. Always subtract them from your gross profit to get the real story.
Another common slip-up happens when you're selling options. When you write a call or a put, the premium you receive is your maximum potential gain on that trade. It's income, not a hurdle you have to clear.
A Quick Sanity Check Before You Trade
To keep your numbers honest, run through a quick mental checklist before you hit that "confirm order" button. It only takes a few seconds.
- Did I account for all the costs? Think commissions and fees, not just for opening the trade, but for potentially closing it out, too.
- Am I using the right multiplier? It's fundamental, but easily forgotten in the heat of the moment: one standard options contract controls 100 shares.
- How will time decay impact this? A quick check on theta helps you remember how your position's value will change as the clock ticks toward expiration.
Turning this into a habit is one of the best things you can do. It's a simple discipline that ensures your profit estimates are consistently grounded in reality, not just wishful thinking.
Questions On Every Trader's Mind

As you get comfortable with the math, a few common questions always pop up. Let's tackle them head-on.
How Do You Find a Call Option's Break-Even Point?
This one’s simple. Just add the premium you paid per share to the strike price. For you to actually make money, the stock has to be trading above that combined number when the option expires.
How Do Commissions Affect Final Profit?
Commissions and fees are the silent killers of profit. They come directly out of your bottom line. Always, always, always subtract every single transaction cost from your gross profit to see what you really walked away with.
Can You Calculate Profit Before an Option Expires?
Absolutely. You can track your unrealized profit (or loss) at any moment. This is based on the option's current market price—its premium—not its intrinsic value. Your running P&L is simply the current premium minus what you originally paid for it.
What Happens If an Option Expires Worthless?
If you bought an option and it expires out-of-the-money (OTM), your loss is 100% of the premium you paid, plus any commissions. This is your maximum possible loss on the trade, which is one of the key benefits of buying options.
Ready to stop guessing and start making data-driven decisions? Strike Price provides real-time probability metrics and smart alerts to help you find high-reward opportunities and manage risk.