How to Calculate Portfolio Returns Like a Pro
If a stock moves past your strike, the option can be assigned — meaning you'll have to sell (in a call) or buy (in a put). Knowing the assignment probability ahead of time is key to managing risk.
Posted by
Related reading
A Step-by-Step Covered Calls Example for Consistent Income
Unlock consistent income with our step-by-step covered calls example. This guide breaks down the strategy, risks, and outcomes to help you trade confidently.
Long Call and Short Put The Ultimate Synthetic Stock Guide
Unlock the power of the long call and short put strategy. This guide explains how synthetic long stock works, its benefits, risks, and how to execute it.
What is a Call Spread? A Clear Guide to Bull and Bear Spreads
What is a call spread? Discover how bull and bear spreads limit risk and sharpen your options trading strategy.
Figuring out your portfolio returns really comes down to three main methods: Simple Return for a quick peek, Time-Weighted Return (TWR) for comparing your strategy to a benchmark, and Money-Weighted Return (MWR) to see how your own timing with deposits and withdrawals played out.
Each one tells a completely different story, so picking the right one is key.
What Is Your Portfolio Really Earning?
Before we get into the weeds with formulas, let's be clear about what we're trying to measure. Calculating your portfolio's return isn't just a math exercise; it's the only real way to know if your investment strategy is actually working.
Without this feedback, you're flying blind. You can't tell the difference between smart decisions and just getting lucky in a bull market.
The method you choose completely changes the story your numbers tell. Think of it like this:
- Simple Return is like checking your car's top speed on a flat, empty road. It’s a pure measure under ideal conditions but doesn’t reflect real-world driving with hills, traffic, and stops for gas.
- Time-Weighted Return (TWR) is your "manager" score. It strips out the impact of when you added or withdrew money, focusing only on how well your actual investment picks performed. This is what you use to fairly compare your results to the S&P 500.
- Money-Weighted Return (MWR) is your "investor" score. It’s the most personal one because it accounts for both your investment choices and your timing. If you threw a big chunk of cash in right before a market rally, your MWR will show how brilliant that move was.
Finding the Right Method for You
A core concept behind most of these calculations is the Holding Period Return (HPR). It’s the total return over the entire time you own an asset.
For example, say you buy Apple shares at $175, get a $0.24 dividend, and the stock eventually hits $200. Your HPR is 14.42%. The formula—(Ending Value - Beginning Value + Income) / Beginning Value—is the bedrock of the simple return method. You can find more detail on the HPR method and its applications on portseido.com.
But the second you start adding or withdrawing funds, a simple HPR can get really misleading. That’s why choosing the right calculation is so critical for getting a true picture of your performance.
The most common mistake I see investors make is using a simple return calculation on an account where they've made contributions or withdrawals. It almost always leads to a warped sense of performance, making it impossible to know if their strategy is actually effective.
Which Return Calculation Method Should You Use?
Choosing the right method can feel confusing, but it's actually pretty straightforward once you know what you're trying to measure. Are you just looking for a quick gut check, or are you trying to see if your stock-picking skills are better than a benchmark?
This table breaks down the three primary methods to help you pick the right tool for the job.
| Method | Best For | Accounts for Cash Flows? | Complexity |
|---|---|---|---|
| Simple Return | Quick checks on static portfolios | No | Low |
| Time-Weighted Return (TWR) | Comparing your strategy to benchmarks | No (it isolates them) | Medium |
| Money-Weighted Return (MWR) | Measuring your personal performance and timing | Yes | High |
Ultimately, there's no single "best" method—just the best one for the question you're asking. For most investors, using a combination of TWR (to judge the strategy) and MWR (to judge personal timing) provides the most complete and honest view of performance.
Calculating Simple Returns for a Quick Snapshot

Let's start with the basics. The easiest way to get a feel for your portfolio's performance is by calculating its simple return, often called the Holding Period Return (HPR).
This is your go-to metric for a clean, straightforward look at growth, especially if you haven't been adding or withdrawing cash. Think of it as the perfect tool for a "set it and forget it" investor who just wants a quick progress report. It answers one simple question: "How much did my initial investment actually grow?"
The Simple Return Formula
You only need three numbers to figure this out: the portfolio's starting value, its ending value, and any income you collected along the way, like dividends.
The formula looks like this:
(Ending Value - Beginning Value + Income) / Beginning Value
Let's walk through a real-world example. Say you started the year with a $10,000 portfolio. By the end of the year, it grew to $11,500. During that time, your holdings also paid out $250 in dividends.
Plugging those numbers into the formula:
- Calculation:
($11,500 - $10,000 + $250) / $10,000 - Result:
$1,750 / $10,000 = 0.175 - Simple Return: That gives you a solid 17.5% return for the period.
It’s a quick, back-of-the-napkin calculation that gives you a clear snapshot of performance over that specific holding period.
When Simple Returns Fall Short
So, what's the catch? The big limitation here is cash flow. The moment you deposit new funds or pull money out, the simple return formula gets skewed and can become seriously misleading.
A large deposit, for instance, will artificially inflate your ending value, making your investment skills look way better than they actually were.
This is a crucial point many new investors miss. Using a simple return calculation on a portfolio with active contributions will completely distort your true performance. It makes it impossible to judge whether your investment strategy is actually working.
For this reason, while HPR is a great starting point, it's really best for static portfolios or for measuring performance over short periods between any cash flow events.
To get a more accurate picture over longer timelines where you're adding or withdrawing money, you'll need to learn how to calculate annualized return, which levels the playing field for different time frames. And while our focus here is on stock portfolios, understanding how to calculate capitalization rates for real estate investments can offer a valuable perspective on how different asset classes generate returns.
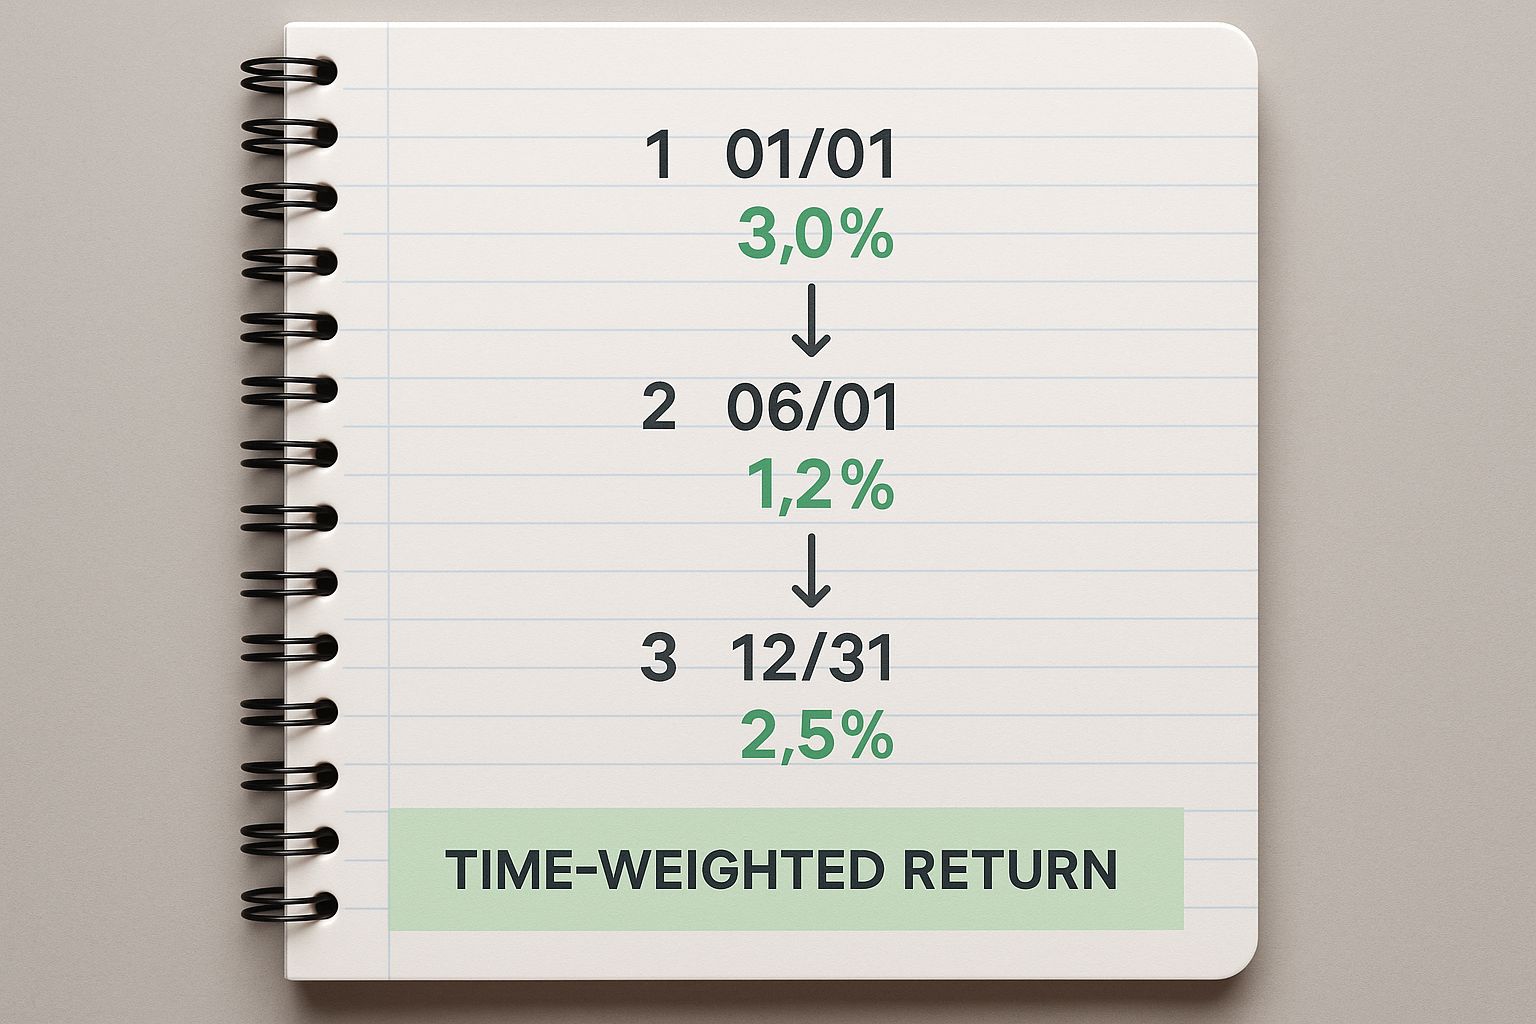
Using Time-Weighted Return for True Benchmarking
If you want to know how your actual trading strategy is performing, you need to strip away the noise. That’s where the Time-Weighted Return (TWR) comes in. It’s the best way to see how your picks are really doing against something like the S&P 500, because it completely ignores the impact of when you add or withdraw cash.
Think of it this way: imagine you start the year with a $50,000 portfolio. Six months in, you decide to add another $10,000. The TWR method essentially splits your year into two distinct periods—one before the deposit and one after. By calculating the return for each little period and then linking them together, you get a pure measure of your strategy’s performance.
Calculate Subperiod Returns
First things first, you need to break your timeline down. Every time you deposit or withdraw money, you create a new "subperiod." The key is to note the portfolio's value right before any cash moves in or out.
Let’s run with our example. Your initial $50,000 grows to $55,000 right before you add the extra cash. That’s a 10% return for your first subperiod ($55,000 / $50,000 - 1).
After you deposit the $10,000, your new starting value is $65,000 ($55,000 + $10,000). By the end of the year, it grows to $71,500. Your return for the second subperiod is also 10% ($71,500 / $65,000 - 1). Now you have the building blocks for the real calculation.
This process highlights how splitting returns around your cash flows gives you that clean, apples-to-apples comparison you need for proper benchmarking.
Link Subperiods for the Final TWR
Once you have the return for each subperiod, you just chain them together. It’s a bit of simple multiplication.
In our example, the calculation looks like this: (1 + 0.10) × (1 + 0.10) - 1. That works out to 1.21 - 1, giving you a total TWR of 0.21, or 21% for the year.
This method completely removes the distortion caused by the timing of your deposits. It gives you the pure, unadulterated growth rate of your strategy. That's the number you can confidently hold up against any benchmark.
Key Takeaway: TWR is the industry standard for measuring a fund manager’s skill precisely because it neutralizes the impact of cash flows, which are often outside of their control.
Apply TWR to Compare Against Benchmarks
With your TWR in hand, you can finally do a real comparison. You found your portfolio’s TWR was 21%. Now, you pull up the S&P 500’s performance for the exact same period. If the index returned 18%, congratulations—you officially outperformed the market.
This same logic applies no matter how many times you add or withdraw money. Every cash flow event just creates another link in the chain. My advice? Keep your records tidy in a spreadsheet with clear date labels from the start.
Here are a few practical tips I’ve learned for applying TWR:
- Build a spreadsheet template to automate the subperiod calculations. It saves a ton of time.
- Clearly label every cash flow with the date and amount. It’s amazing how easy it is to make a mistake otherwise.
- Double-check your benchmark data. Make sure the timing and the source are solid for an accurate comparison.
While you're at it, you might find our guide on how to backtest a trading strategy useful. It dives into running historical simulations to see how your ideas would have performed in the past.
When you use TWR alongside rigorous backtesting, you're building a seriously powerful toolkit. You’ll know exactly how your strategy stacks up against the big indexes and how it might have held up over time.
How to Manage Multiple Cash Flow Events
Things can get complicated when you’re making frequent deposits and withdrawals. Your timeline starts to look like a long series of short subperiods.
This is where a flexible spreadsheet becomes your best friend. From day one, I’ve made it a habit to label every single entry in my trading journal—date, amount, and purpose (deposit, dividend, etc.). It’s a simple discipline that has saved me countless hours of debugging mistakes down the road.
Here are a few more tips for scaling up your TWR calculations:
- Use named ranges in Excel or Google Sheets to refer to deposit values. It makes formulas much cleaner.
- Color-code the rows with cash flows. This visual cue helps ensure you don’t miss an event when linking subperiods.
- Always do a quick sanity check on each subperiod's return. If a number looks wildly off, it probably is.
If you’re serious about learning how to calculate portfolio returns, mastering TWR is non-negotiable. Once you get the hang of it, tracking the true performance of your strategies—whether it's covered calls on a platform like Strike Price or a simple buy-and-hold portfolio—becomes second nature.
Measuring Your Personal Success with Money-Weighted Return
While the Time-Weighted Return (TWR) is great for grading your investment strategy, it leaves out a huge piece of the puzzle: your actual performance as the person calling the shots. This is where the Money-Weighted Return (MWR) comes in.
MWR measures how your own decisions—specifically, when you add or withdraw money—impacted your bottom line. Think of it as your personal ROI. It’s the same thing as the Internal Rate of of Return (IRR), and it finds the single growth rate that explains how your portfolio got from its starting value to its ending value, accounting for every dollar you put in or took out.
If you have a high MWR, it means you didn't just pick good investments; you also added money at the right times.
How Your Timing Changes Everything
The magic of the MWR is that it's sensitive to cash flows. It rewards investors who add capital right before the market takes off and penalizes those who contribute just before a dip.
Let’s look at an example. Imagine an investor, Alex, starts the year with $100,000. Six months in, the portfolio is up to $110,000—a solid 10% gain. Seeing this momentum, Alex decides to add another $50,000. The portfolio, now worth $160,000, then grows another 10% in the second half of the year, finishing at $176,000.
Alex’s TWR for the year is 21%, because it only looks at the performance of the assets themselves. But the MWR will be higher, because that second 10% gain was applied to a much larger pile of money, all thanks to that well-timed contribution. That’s where MWR really shines.
Your Money-Weighted Return is the ultimate accountability metric. It doesn't just measure your strategy's performance; it measures your performance as the portfolio's chief decision-maker.
Skip the Hard Math—Use a Spreadsheet
Calculating IRR by hand involves some gnarly algebra that nobody has time for. Thankfully, you don’t have to. Both Google Sheets and Microsoft Excel have a built-in function that does all the work for you: XIRR.
This function was made for this exact scenario—calculating the return for a series of cash flows happening on different dates. All you need to give it is two things:
- A list of your cash flows: Your initial investment is a negative number (cash leaving you). Contributions are negative, and withdrawals are positive. Your final portfolio value goes in as a positive number.
- The dates for each cash flow: Timing is everything, and XIRR handles irregular dates perfectly.
Putting XIRR into Practice
Let's go back to Alex’s portfolio and calculate the MWR using the XIRR function. You'd set up a simple table in a spreadsheet like this one:
| Date | Cash Flow |
|---|---|
| Jan 1, 2024 | -100,000 |
| Jul 1, 2024 | -50,000 |
| Dec 31, 2024 | 176,000 |
In the formula bar, you'd type =XIRR(B2:B4, A2:A4), assuming your cash flows are in column B and your dates are in column A.
The result? The spreadsheet spits out an annualized MWR of 22.5%.
Notice this is higher than the 21% TWR. That's because Alex's smart decision to add $50,000 mid-year gave the second-half returns a much bigger base to grow from. Learning how to use XIRR is one of the most practical skills you can have for getting a real, honest look at how you're doing.
Tools and Tips for Effortless Portfolio Tracking

Let's be honest: nobody wants to be stuck calculating portfolio returns with a pencil and paper. The good news is, you don't have to. We're going to walk through some practical tools and workflows that make tracking your investments easy and, more importantly, reliable.
You’ll get a peek at a ready-to-go Google Sheets template and a quick rundown of the top apps out there. Plus, we'll cover the crucial stuff—like fees and inflation—so you can see what your real gains actually are.
Set Up a Google Sheets Template
You'd be surprised how powerful a simple spreadsheet can be. With the right setup, you can automate your HPR and XIRR calculations, letting the formulas do all the heavy lifting as you add new data.
Start by creating clear columns: Date, Cash Flow, Value, HPR, and XIRR. A pro tip is to protect the cells with your formulas so you don't accidentally delete them later.
- HPR Formula: Plug in
(Value End – Value Start + Income) / Value Startto see the return for each specific period. - XIRR Function: The magic here is
=XIRR(CashFlows, Dates). This gives you the money-weighted return in seconds. - Dynamic Range: Use named ranges for your data. This lets your formulas automatically include new entries without you having to rewrite a thing.
Choose Popular Tracking Apps
For a real-time pulse on your portfolio, tracking apps are fantastic. Many of them can link directly to your brokerage accounts through secure APIs, giving you a complete financial picture at a glance.
Platforms like Personal Capital, Kubera, and Finary are popular for a reason, but they each have their own strengths and weaknesses. Some are free to start but will charge for the more advanced features.
| App | Key Feature | Price Model |
|---|---|---|
| Personal Capital | Free net worth tracker | Free with advisory fees |
| Kubera | Multi-currency support | $150/year |
| Finary | Crypto and stock blend | Free basic, tiers at €99 |
Integrate Brokerage Dashboards
Don't forget about the tools your broker already provides. Most platforms like Fidelity, Schwab, and Robinhood have built-in portfolio analytics that are perfect for cross-checking the numbers from your spreadsheet.
These dashboards are great for highlighting things like unrealized gains, spotting tax-loss harvesting opportunities, and keeping an eye on your margin ratios. Some will even send you automated alerts if your performance strays too far from your targets.
- Link your API keys (securely!) to automatically pull in your holdings every day.
- Turn on email notifications for any sudden value drops of 5% or more.
- Bookmark the summary screens and remember you can usually export PDF reports for your records.
Account for Hidden Performance Killers
This is a big one. Fees, taxes, and inflation are silent portfolio killers that can seriously erode your returns over time. Even a seemingly small 1% annual fee can slash your cumulative gains by over 10% in just a decade.
Get in the habit of subtracting trading costs and management fees from your gross returns each month. After that, adjust your results for inflation using official CPI or PPI data to see how your purchasing power is really doing.
- Review your fee schedules every quarter to spot any creeping costs.
- Keep a separate tab in your spreadsheet to track taxable events. This will help you get a much clearer picture of your true net returns.
- Apply a conservative inflation rate of 2–3% annually to your numbers to gauge your real growth.
Real returns are what truly matter. Once you start accounting for fees and inflation, you get an honest look at your portfolio’s actual growth path.
One landmark study dug into global multi-asset market returns from 1960 to 2017. It found a compounded real return of 4.45% per year in USD, but with an 11.2% standard deviation. You can discover more insights about historical market portfolio returns on Robeco.
And if you need guidance on keeping your portfolio aligned with your goals, check out our guide on How to Rebalance Your Portfolio.
With these tools and tips in your back pocket, tracking your returns goes from being a chore to an effortless, accurate process. You'll spend less time crunching numbers and more time making smart decisions to optimize your strategy.
Common Questions on Calculating Portfolio Returns
Even after you've got the formulas down, the practical side of calculating your portfolio's return can throw a few curveballs your way. Let's walk through some of the most common questions investors run into. Clearing these up will help you avoid some classic pitfalls.
Why Is My Brokerage Return Different From My Calculation?
This is a big one. You run the numbers, then you log into your account, and the two figures don't match. It’s a super common source of confusion, and the reason is almost always the same: you and your broker are using different formulas.
Most investors start by calculating a simple return. Brokerages, on the other hand, almost always use either a Time-Weighted Return (TWR) or a Money-Weighted Return (MWR).
- TWR is what you’ll often see on performance charts. It’s designed to measure pure investment skill by ignoring the timing of your deposits and withdrawals.
- MWR is sometimes called your "Personal Rate of Return" because it does the opposite—it shows you exactly how your decisions to add or pull money affected your final outcome.
The fix is simple. Just check your brokerage’s help section or FAQ page. They'll tell you which method they use, and that usually solves the mystery right away.
How Often Should I Calculate My Portfolio Return?
For most people investing for the long haul, digging into detailed return calculations on a quarterly or annual basis is more than enough. This rhythm keeps you informed without dragging you into the short-term noise of the market.
Checking your returns daily or weekly is a recipe for emotional decision-making. You see a dip and want to panic sell, or you see a stock pop and feel the urge to chase it. It’s better to stick to a consistent schedule that lines up with when you’d normally review your overall strategy.
Over-analysis can be just as damaging as no analysis. Calculating returns too often encourages a short-term mindset, which is the enemy of successful long-term investing. A quarterly check-in is the sweet spot for staying informed without becoming obsessive.
Do I Include Fees and Taxes in My Return Calculation?
Absolutely. If you want a real, honest picture of your performance, you have to calculate your return after fees and taxes. This is your "net return," and it's the only number that truly matters. It's the actual cash you've earned that you can reinvest or spend.
Hidden costs like trading commissions, expense ratios on funds, and advisory fees can quietly eat away at your gains over the years. A seemingly tiny 1% annual fee can shave tens of thousands of dollars off your final portfolio value over a few decades. Factoring these costs into your calculations is the only way to understand their true impact and make smarter decisions to protect your wealth.
Ready to turn guesswork into a data-driven strategy? Strike Price provides real-time probability metrics for every strike price, empowering you to sell covered calls and secured puts with confidence. Get smart alerts, track your contracts, and generate tailored strategies to meet your income goals. Start making more informed trades today at https://strikeprice.app.