How to Choose Option Strike Price: Expert Tips and Strategies
If a stock moves past your strike, the option can be assigned — meaning you'll have to sell (in a call) or buy (in a put). Knowing the assignment probability ahead of time is key to managing risk.
Posted by
Related reading
A Step-by-Step Covered Calls Example for Consistent Income
Unlock consistent income with our step-by-step covered calls example. This guide breaks down the strategy, risks, and outcomes to help you trade confidently.
Long Call and Short Put The Ultimate Synthetic Stock Guide
Unlock the power of the long call and short put strategy. This guide explains how synthetic long stock works, its benefits, risks, and how to execute it.
What is a Call Spread? A Clear Guide to Bull and Bear Spreads
What is a call spread? Discover how bull and bear spreads limit risk and sharpen your options trading strategy.
Choosing an option's strike price is where your trading plan finally meets the market. This isn't just about picking a random number; it's about making a deliberate choice that aligns with your market forecast, your stomach for risk, and what you're actually trying to achieve.
The right strike price balances potential profit against the upfront cost of the contract. It’s the decision that determines whether you're playing for a high-probability win or swinging for a high-reward home run.
The Trader's Dilemma: Understanding Strike Price

Before you can pick the perfect strike, you have to get comfortable with the fundamental trade-offs. Every single option contract presents a different balance of risk and reward, and it's all tied directly to its strike price relative to where the stock is trading right now. This relationship is everything.
There's no secret formula here. It’s all about making an informed choice that fits your specific goal for the trade. Are you looking to generate some consistent income by selling premium? Or are you speculating on a huge price explosion? Your answer immediately narrows the field of potential strikes.
The Three Moneyness Categories
Every option falls into one of three buckets based on its strike price. If you’re learning how to choose an option strike price, getting these down is non-negotiable.
- In-the-Money (ITM): These options already have intrinsic value. A call is ITM if its strike is below the stock's current price; a put is ITM if its strike is above. They cost the most, but they also have the highest probability of finishing profitable.
- At-the-Money (ATM): Just like it sounds, these options have a strike price that’s very close to the current stock price. They offer a middle ground, balancing the cost of the premium with a high sensitivity to price changes.
- Out-of-the-Money (OTM): These options have zero intrinsic value and are the cheapest of the bunch. A call is OTM if its strike is above the stock's price; a put is OTM if its strike is below. They offer the chance for massive percentage returns, but they come with a much lower probability of success.
Think of it like this: An ITM option is like betting on the favorite—it costs more to place the bet, but your odds are better. An OTM option is the longshot—a cheap ticket with a lower chance of winning, but a huge payout if you’re right.
To make this even clearer, let's break down the key differences in a simple table. This helps you see the trade-offs at a glance when you're looking at an option chain.
Strike Price Categories at a Glance
| Category | Key Characteristic | Typical Delta (Approx.) | Premium Cost | Probability of Profit |
|---|---|---|---|---|
| In-the-Money (ITM) | Has intrinsic value; highest cost | > 0.60 | High | Highest |
| At-the-Money (ATM) | Strike price near current stock price | ~ 0.50 | Medium | Medium |
| Out-of-the-Money (OTM) | No intrinsic value; lowest cost | < 0.40 | Low | Lowest |
As you can see, there's a direct relationship between cost, risk, and potential reward. Your job is to decide where on this spectrum you want to be for any given trade.
The Role of Probability and Premiums
Ultimately, your choice of strike price is a numbers game. You're trying to maximize your returns while managing risk, and that often comes down to statistics. A key metric here is the option's Delta, which gives you a rough estimate of how much the option's price will move for every $1 change in the underlying stock.
For example, an at-the-money option typically has a Delta around 0.50. This means it will gain or lose about $0.50 in value for each dollar the stock moves, making ATM options very responsive but also more expensive.
On the other hand, far OTM options have tiny Deltas and cheap premiums, but a much lower probability of ever becoming profitable by expiration. If you want to dive deeper into the mechanics, you can explore more about option pricing models on Optionistics.com.
It all boils down to one simple question: What are you trying to accomplish with this trade? Answering that honestly is the most important step you can take.
Matching Strike Price to Your Trading Style
Before you even glance at an options chain, the most important work happens in the mirror. Choosing the right strike price isn't about some magic formula; it starts with an honest look at your own goals and what level of risk you're truly comfortable with.
Are you trying to generate a steady paycheck from your portfolio? Or are you swinging for the fences on a speculative bet?
Your answer to that question is everything. It's the foundation for your entire trading plan. Without that clarity, you're just picking strikes based on gut feelings, and that’s not a repeatable strategy. The "perfect" strike price is simply the one that fits you.
The Conservative Income Generator
This is the trader who values consistency above all else. The goal here isn’t to hit home runs; it's to collect premium, month after month, creating a reliable income stream from stocks you already own. For this trader, managing risk is job number one.
If this sounds like you, you'll be living in the world of high-probability strategies like covered calls and cash-secured puts. You're looking for steady singles, not grand slams.
For these strategies, you'll naturally gravitate toward strikes that are:
- At-the-Money (ATM): These offer a very healthy premium but also bring a roughly 50/50 chance of having your shares called away or being assigned stock on a put. It's a classic risk-reward trade-off.
- Slightly Out-of-the-Money (OTM): This is often the sweet spot for income seekers. You're collecting a respectable premium while building in a safety buffer, which lowers the odds of assignment. For example, selling a call with a strike 5% above the current stock price.
The logic is simple: the further OTM you go, the less premium you collect, but the safer you are. Conservative traders almost always lean toward safety. For a much deeper look, our guide on how to sell covered puts walks through this income-focused approach step-by-step.
The Balanced Growth Seeker
This trader is willing to take on more calculated risk to chase a better return. The goal isn't just about collecting premium—it's about capturing a directional move in a stock without having to buy all the shares outright.
This style is more active, involving buying calls or puts based on a clear idea of where you think the stock is headed. You might also use debit spreads to define your risk upfront and lower your cost to enter the trade.
Your strike selection becomes more dynamic:
- Slightly Out-of-the-Money (OTM): These give you a great balance of cost and leverage. You get more bang for your buck than an ATM option, but with a much higher probability of success than a far OTM lottery ticket.
- At-the-Money (ATM): These are perfect for when you expect a quick, decisive move. ATM options have the highest sensitivity to the underlying stock's price changes (gamma), which means they can get profitable in a hurry if you're right.
Key Takeaway: A balanced approach isn't just about premium. You're making a directional bet and picking a strike that gives you a realistic shot at being right before the clock runs out on your option.
The Aggressive Speculator
This trader is all about one thing: maximizing leverage for explosive returns. The goal is to cash in on high-volatility events like earnings reports or major news, where a stock might make a massive, unexpected move.
If this is your style, you fully accept that most of your trades will probably expire worthless. You're playing for that one trade that delivers a 5x, 10x, or even 20x return, making up for all the small losses along the way.
The strike selection here is straightforward:
- Far Out-of-the-Money (OTM): You’re buying very cheap calls or puts that have a low probability of ever being profitable. The entire appeal is the gigantic potential payout if the impossible happens and the stock skyrockets or plummets right past your strike.
This is, by far, the riskiest way to trade. It requires small position sizes and the discipline to know that losing 100% of what you paid for the option is the most likely outcome. It's a high-stakes game that demands extreme caution.
Putting Delta and Probability to Work for You
This is where theory hits the real world. At its core, options trading is a game of probabilities. The "Greeks," especially Delta, are your best tools for measuring those odds in real-time. This is how you move past gut feelings and start building a real, sustainable edge.
Think of Delta as more than just a number that tracks price changes. It's a live, constantly updating proxy for an option's probability of expiring in-the-money (ITM). Your trading platform shows you this number for every single strike, and learning to read it is a total game-changer.
It’s surprisingly straightforward. A call option with a 0.30 Delta has, give or take, a 30% chance of finishing ITM by its expiration date. A put with a -0.20 Delta has about a 20% chance of doing the same. Just like that, you can quantify your risk before you ever place a trade.
How to Build Strategies Around Probabilities
Once you start seeing Delta as a probability gauge, you can build trades that perfectly match your goals and comfort level with risk.
Let's say you want to generate some income by selling a credit spread. Your goal is simple: pick a strike that the stock is unlikely to hit. If you sell a call option with a Delta under 0.20, you’re statistically giving yourself an 80% or better chance that the option expires worthless. That means you get to pocket the entire premium.
Or what if you're feeling bullish and want to make a directional bet? You could set up a debit spread. Maybe you buy a call with a 0.70 Delta (giving you a high probability of being right) and then sell a further out-of-the-money call with a 0.50 Delta to help pay for it. This move defines your max risk right from the start and hones your bet on a specific price move.
By framing your strike selection in terms of probability, you shift from a mindset of "I hope this works" to "I am taking a calculated risk with quantifiable odds." This is the cornerstone of disciplined trading.
This flow chart breaks down how your own risk tolerance should directly guide your strike selection process.
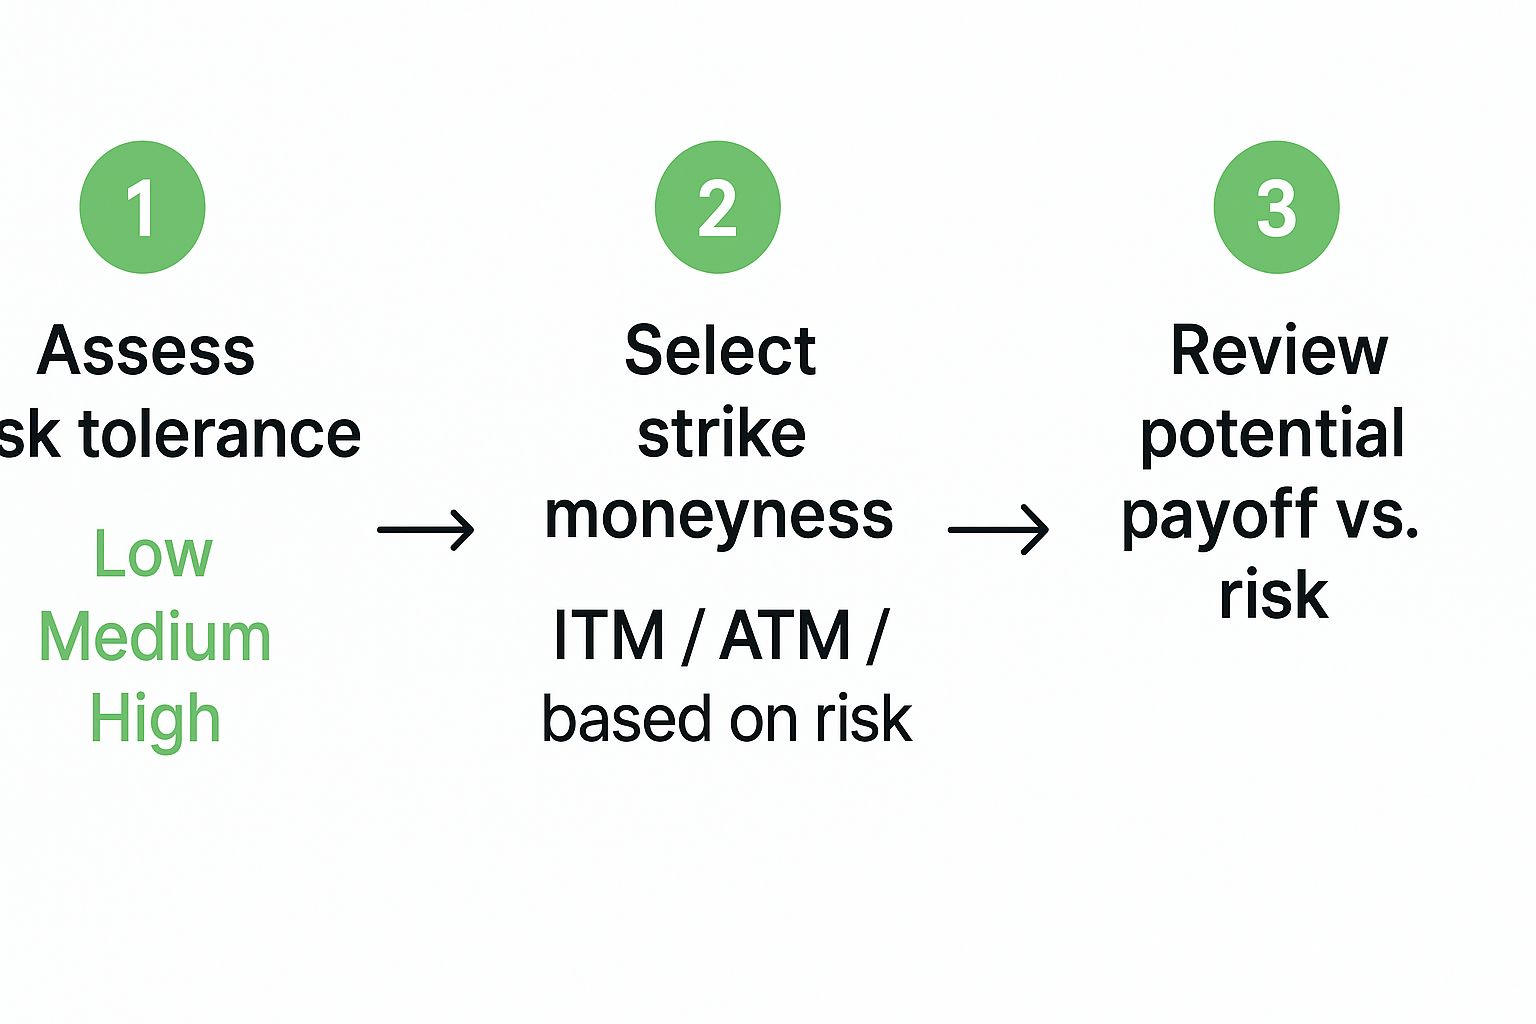
It’s a simple but powerful visual: your personal risk appetite comes first, which then points you toward ITM, ATM, or OTM strikes before you finally review the potential outcomes.
The Wild Card: Implied Volatility
Now, while Delta is an amazing guide, it doesn't tell the whole story. The market's own prediction of future price swings—what we call implied volatility (IV)—can throw a wrench in the works, skewing the simple probabilities that Delta suggests.
When IV is high, maybe right before an earnings report, the premiums for both calls and puts get more expensive across the board. Why? Because the market is pricing in a much bigger chance of a dramatic price move, up or down.
This creates a common pattern known as the "volatility smile." If you were to graph the IV levels for every strike in a single expiration cycle, it would often form a smile shape. The IV is typically highest for the deep in-the-money and far out-of-the-money options and lowest for the ones right at-the-money.
Knowing this can help you spot opportunities. Sometimes, those far OTM options get ridiculously expensive because of pumped-up IV, making them a great target for sellers who think the market is overreacting. On the flip side, a sudden dip in IV on a specific strike might be a bargain for a buyer.
This isn't just a retail trader's game. Big institutional firms and researchers dig into massive sets of historical options data to fine-tune their strategies. The data often shows that strikes closer to the money with moderate IV tend to deliver more consistent results than the cheap, far OTM lottery tickets. If you're curious about the kind of data the pros use, you can see how institutional data powers options analysis on OptionMetrics.com.
This is the kind of clean, organized data that allows traders to backtest their ideas about strike selection and volatility, turning abstract concepts into a real trading plan. When you combine Delta with a sharp eye on IV, you start making smarter, more nuanced decisions about where to place your money.
Integrating Technical Analysis for Precision Strikes
Probabilities are fantastic, but they don't tell the whole story on their own. The best traders I know have a knack for blending these hard numbers with a classic, "eyes-on-the-chart" analysis of the underlying stock. This is where you connect the dots between what the math suggests and what the market is actually doing.
When you bring technical analysis into the picture, you’re adding invaluable context. You can literally see where a stock has run into buyers or sellers in the past, giving you solid price levels to build your trade around. It can turn a pretty good setup into a fantastic one.
Using Support and Resistance as Signposts
Think of support and resistance levels as the major landmarks on a stock's price map. Support is a price floor where a downtrend often stalls out because buyers tend to step in. Resistance is the ceiling—a price level where rallies can lose steam as sellers take control.
These levels are your signposts for picking a strike with much greater confidence.
For Bullish Trades (Buying Calls): Let’s say you're bullish on a stock trading at $100. The chart shows a solid resistance level at $110 that has capped the price before. Instead of guessing, you could target a strike just below that ceiling, like $108 or $109, positioning yourself to profit as the stock climbs toward that wall.
For Bearish Trades (Buying Puts): On the flip side, if you see a big support level at $90, that becomes your target for a bearish play. Buying a put with a strike at $92 or $91 sets you up to gain from the stock’s move down toward that known support zone.
This approach grounds your strike selection in real-world market behavior, not just abstract odds. You're lining up your trade with price zones where a reaction is likely.
Pro Tip: I always look for support and resistance levels that have held up multiple times, especially on the daily or weekly charts. The more a level is tested and holds, the more weight other traders give it.
Selling Premium with a Technical Buffer
For those of us who sell options, technical analysis is all about creating a safety buffer. Your primary goal is to collect that premium while the stock price stays far away from your strike. Support and resistance levels are perfect for this.
Imagine you're looking to sell a cash-secured put on that same $100 stock. A quick look at the chart reveals a huge, long-term support level at $90 that has acted as a floor for months. By choosing a strike below this level—say, at $88 or $87.50—you’re giving yourself a serious cushion.
Even if the stock dips, it has to chew through that entire area of known buying interest before it even gets to your strike. This can dramatically stack the odds in your favor for the option to expire worthless, letting you pocket the full premium.
The same logic applies to selling covered calls. If there’s a stubborn resistance ceiling at $110, selling a call with a strike at $112 or $113 creates a buffer that helps protect your shares from being called away.
Incorporating Indicators for a Dynamic Range
Beyond just drawing lines on a chart, technical indicators like Bollinger Bands and moving averages can help you define a stock's probable trading range, adding another layer of insight.
Bollinger Bands: These bands expand and contract with volatility, forming a dynamic channel around the price. The upper band often acts as temporary resistance, and the lower band as temporary support. A very common strategy for premium sellers is to pick strikes just outside these bands for high-probability trades.
Moving Averages: Key moving averages, especially the 50-day and 200-day, are watched like a hawk by big institutional players. They often function as major support or resistance. Selling a put with a strike safely below the 200-day moving average is a classic defensive move on a stock you believe in long-term.
Fusing historical stats with key technical levels is a huge part of how experienced traders pick their strikes, particularly in liquid markets. You can discover more insights about these advanced strategies and see how they are put into practice.
Ultimately, by weaving chart analysis into your process, you stop picking strikes in a vacuum. You start making surgically precise decisions backed by both the math and the market's own behavior.
Advanced Strike Selection Considerations
Alright, once you're getting the hang of mixing probability with your chart analysis, it's time to layer in the more nuanced stuff. These are the details that often separate a decent trade from a great one. They help you fine-tune everything, manage risks you might not see at first glance, and stay nimble when the market gets choppy.
First up, and arguably most important, is liquidity. An option can look perfect on paper—the right strike, the right premium—but if nobody is actively trading it, it's a trap. Poor liquidity means you can get stuck, unable to exit your position at a fair price. It's a killer.
You can get a quick read on an option's liquidity by checking two key metrics on your trading platform:
- Open Interest: This is the total number of active contracts out there. A high number—I'm talking hundreds or thousands—is a good sign of a healthy, active market.
- Bid-Ask Spread: This is the gap between what buyers are willing to pay (the bid) and what sellers are willing to accept (the ask). You want this spread to be tight.
A wide bid-ask spread is a huge red flag. Think of it as a hidden tax on your trade that immediately eats into your potential profit. Personally, I won't even touch a strike if the spread is more than a few cents or a tiny percentage of the option's price.
The Influence of Gamma on Your Strike Choice
Beyond liquidity, getting a feel for the "Greeks" is crucial, especially for shorter-term trades. This is where Gamma enters the picture.
In simple terms, Gamma measures how much your option's Delta will change for every $1 move in the underlying stock. It’s the accelerator pedal for your option’s price. High Gamma means your profits (or losses) can pile up incredibly fast with just small moves in the stock.
- High-Gamma Strikes: You'll find these right At-the-Money (ATM). If you buy an ATM call and the stock pops, your Delta might jump from 0.50 to 0.60, then 0.70, and so on. Your position gets more profitable, faster. It’s an aggressive play.
- Low-Gamma Strikes: Options further Out-of-the-Money (OTM) have much lower Gamma. Their Deltas move more slowly, which means less explosive potential but also more stability. This makes them a better fit for longer-term trades or strategies where you're selling premium and want to avoid sharp, sudden moves against you.
Adapting Your Strikes for Earnings Season
Few things throw a wrench in the works like a company's earnings report. The days leading up to an announcement are wild. Implied volatility (IV) goes through the roof as the market braces for a potential huge price gap overnight.
This IV spike completely changes the game for strike selection.
Suddenly, premiums for all options get incredibly expensive. Buying a simple call or put becomes a costly lottery ticket with a sky-high breakeven point, because you're paying for all that baked-in uncertainty.
But for experienced option sellers, this is prime time. The inflated premiums create an opportunity. For traders who want to map out these complex scenarios, learning about building robust financial models can offer a structured way to evaluate your choices.
A common earnings play is to sell strategies like far OTM strangles or iron condors. The idea is to select strikes way outside the stock's expected move, betting that the post-earnings price swing will be less dramatic than what the crazy-high premiums were pricing in. It’s an advanced strategy that carries significant risk and absolutely requires a solid game plan.
Mastering these factors is a core part of any durable options trading risk management approach.
Final Strike Selection Checklist
Before you hit that "confirm trade" button, run through this quick checklist. It’s a simple way to make sure you've considered all the critical factors for a smart, well-reasoned strike selection.
| Checklist Item | What to Look For | Why It Matters |
|---|---|---|
| Probability | Does the Probability of Profit (POP) or Delta align with your risk tolerance? | This is your statistical edge. It quantifies the likelihood of your trade being successful based on historical volatility. |
| Liquidity | Is the Open Interest high (100s/1000s) and the Bid-Ask Spread tight? | Ensures you can enter and exit the trade easily and at a fair price without significant slippage. |
| Chart Levels | Is your strike near a key support or resistance level? Does it make sense technically? | Anchors your statistical trade in the current market structure, adding another layer of confirmation. |
| Gamma Exposure | Is Gamma high (ATM) or low (OTM)? Does this match your trade's goal? | Determines how sensitive your position will be to small price moves. High Gamma for aggressive moves, low for stability. |
| Special Events | Are there earnings, dividends, or other news events before expiration? | Events like earnings dramatically inflate IV, which can either create opportunity (for sellers) or add huge risk (for buyers). |
Going through these five points can be the difference between a random bet and a calculated trade. It takes an extra minute but can save you a lot of headaches down the road.
Frequently Asked Questions
Even with a solid game plan, you're always going to run into specific questions when it’s time to pull the trigger on a trade. This is where the theory meets the road. Think of this as a quick-reference guide for the common hang-ups traders face when picking a strike price.
Which Strike Price Is Best for Beginners?
This is probably the most common question I hear. When you're just starting out, it’s easy to get overwhelmed.
A great place to begin is with At-the-Money (ATM) or slightly In-the-Money (ITM) options. They offer a fantastic balance—you get a decent premium, but the option also moves nicely with the underlying stock. It's the perfect training ground for getting a feel for how options behave in the real world.
How Do Expiration Dates and News Affect My Choice?
The expiration date you pick is directly tied to the strike price you should consider. It's a classic time-versus-distance problem.
If you're making a longer-term bet—say, several months out—you have more runway for the stock to make a big move. This is where you might choose a strike that's further Out-of-the-Money (OTM), giving your thesis time to play out.
On the other hand, if you're trading weeklys, the clock is ticking. With just a few days left, the stock isn't likely to move a massive amount. In these cases, sticking to strikes closer to the current price (ATM) just makes more sense.
The real power comes when you combine Delta with technical analysis. Delta gives you the raw probability, the market's statistical odds. But technical analysis gives you the context—it shows you the actual price levels where a stock might bounce or stall out. When both point to the same conclusion, that’s where you find the A+ setups.
How Do I Find a Good Strike and When Should I Sell Puts?
Never forget about liquidity. A great setup on paper is worthless if you can't get in and out at a fair price.
So, what's a "good" amount of open interest? There's no single magic number, but for popular stocks, I'd want to see open interest in the hundreds, and ideally, the thousands. High volume and open interest lead to tighter bid-ask spreads, which saves you money on every single trade.
This is non-negotiable for strategies like selling puts. For a closer look at how liquidity and strike selection are two sides of the same coin, our guide on a practical put selling strategy breaks it down step-by-step. The bottom line: stay away from strikes with low or zero open interest. They're a recipe for frustration and bad fills.
Ready to stop guessing and start making data-driven decisions? Strike Price provides real-time probability metrics for every strike, empowering you to balance safety and premium income with confidence. Find high-reward opportunities and get risk alerts so you can trade smarter, not harder. Turn your options selling into a strategic, income-generating process at https://strikeprice.app.