How to Read an Options Chain: A Beginner’s Guide
If a stock moves past your strike, the option can be assigned — meaning you'll have to sell (in a call) or buy (in a put). Knowing the assignment probability ahead of time is key to managing risk.
Posted by
Related reading
A Step-by-Step Covered Calls Example for Consistent Income
Unlock consistent income with our step-by-step covered calls example. This guide breaks down the strategy, risks, and outcomes to help you trade confidently.
Long Call and Short Put The Ultimate Synthetic Stock Guide
Unlock the power of the long call and short put strategy. This guide explains how synthetic long stock works, its benefits, risks, and how to execute it.
What is a Call Spread? A Clear Guide to Bull and Bear Spreads
What is a call spread? Discover how bull and bear spreads limit risk and sharpen your options trading strategy.
Reading an options chain is all about scanning a grid of data—strike price, expiration, bid/ask, volume—to size up the available contracts for a stock. Think of it like a menu where all the bullish (call) and bearish (put) options are laid out side-by-side, giving you a real-time snapshot of market sentiment and helping you spot potential trades.
Your First Look at the Options Chain
Jumping into options without knowing how to read the chain is like trying to fly a plane blind. It looks like an intimidating wall of numbers at first, I get it. But once you understand how it's organized, it becomes your most powerful tool for making smart, informed decisions.
At its core, the chain is just a list of every available option contract for a stock. It’s split into two distinct sides:
- Call Options: These give you the right (but not the obligation) to buy a stock at a set price. You’d look at calls if you’re bullish and think the stock is headed up.
- Put Options: These give you the right to sell a stock at a set price. Puts are for when you’re bearish and expect the stock’s price to take a dip.
On most brokerage platforms, you'll see calls on the left and puts on the right. Down the middle, you’ll find the strike prices—that’s the price where the contract can be exercised.
Breaking Down the Layout
Getting this basic layout down is your first step. It's especially important when you consider just how much action the options market sees. On any given day, the U.S. options market can see total daily index options volume hit over 2.8 million contracts. All that activity, with its shifting put/call ratios, tells a story about market sentiment. Mastering the chain is how you learn to read that story. You can even track these daily market statistics to see how sentiment changes over time.
To make this crystal clear, here’s a standard options chain for a fictional stock.
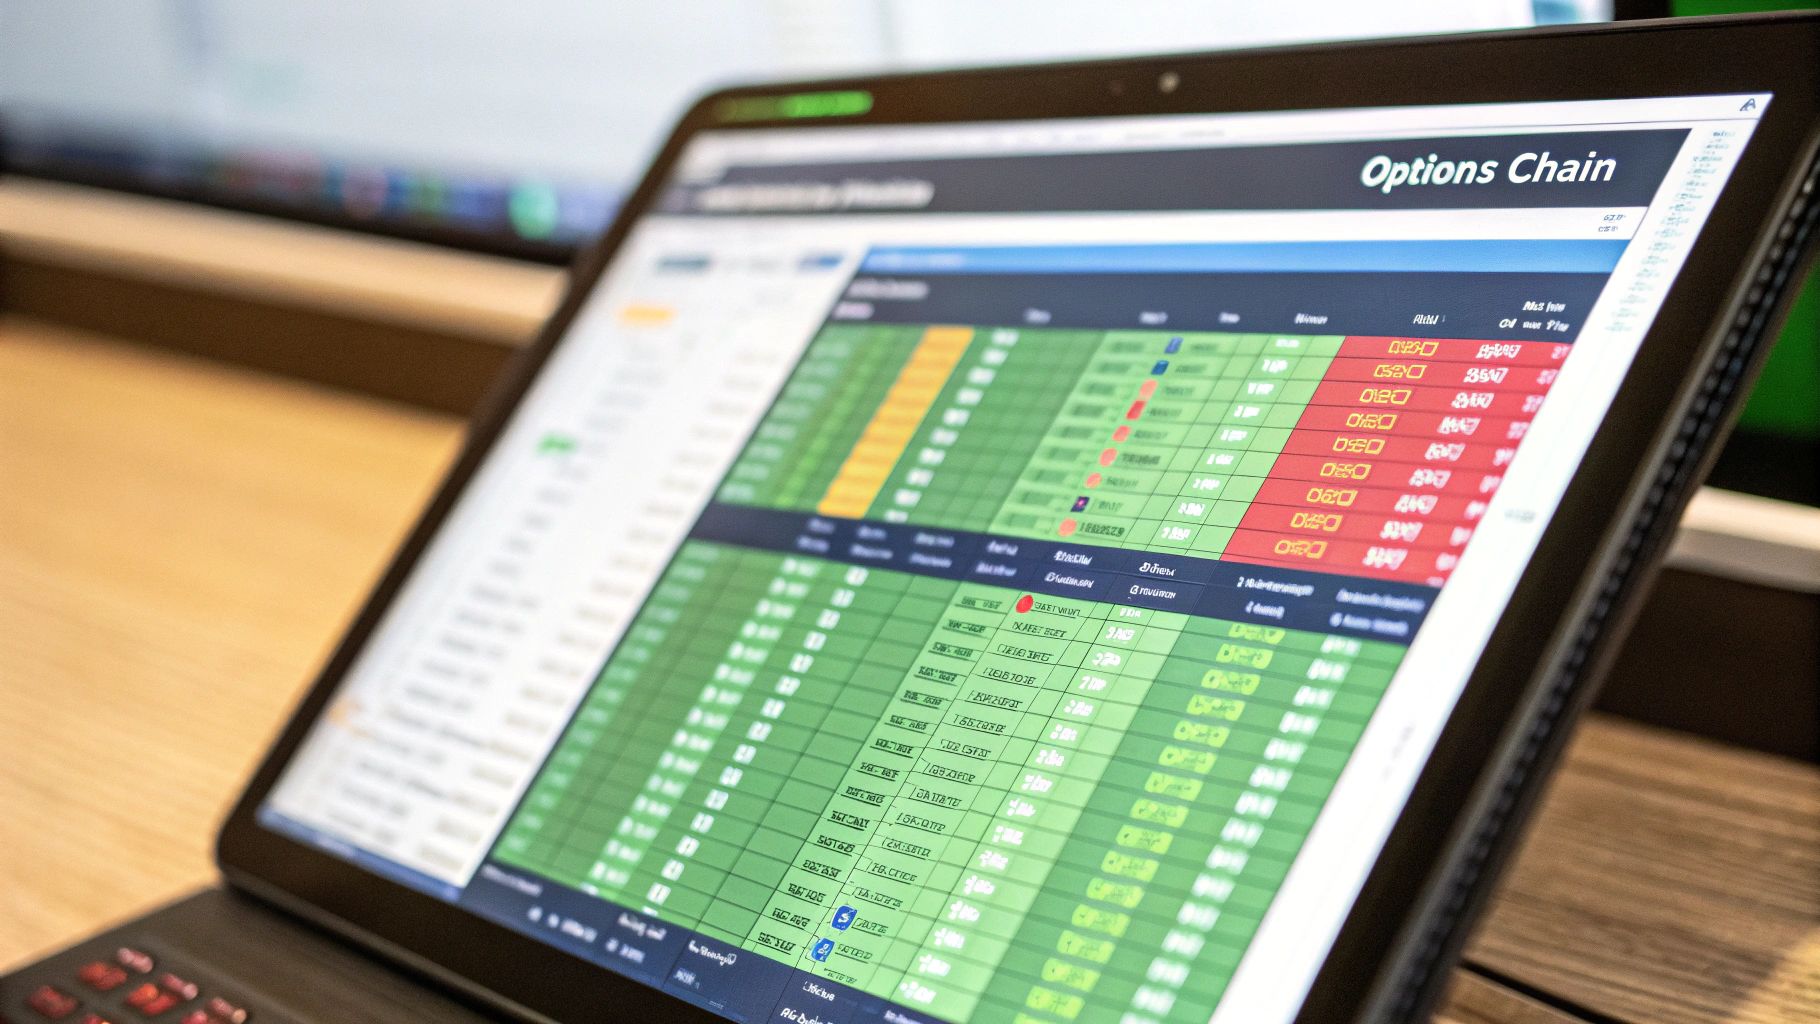
As you can see, this image neatly separates the calls from the puts. It lays out all the key data points—bid, ask, volume, and more—for each strike price, turning a complex table into something you can actually use. Every single column gives you a piece of the puzzle. Learning how to put them all together is what we'll tackle next.
Decoding Strike Price, Expiration, and Moneyness
This is where the real strategy kicks in. Once you’ve got the basic layout down, your attention needs to shift to the three pillars of every single options contract: the strike price, the expiration date, and its "moneyness."
Getting a handle on these concepts is what separates aimless bets from calculated, repeatable trades.
The strike price is simply the fixed price where you get the right to buy (for a call) or sell (for a put) the underlying stock. It’s the central column of the chain and acts as the anchor for every contract you see listed.
Understanding Moneyness: ITM, ATM, and OTM
"Moneyness" sounds complicated, but it’s a straightforward way to describe an option's value relative to where the stock is trading right now. Most trading platforms even color-code the options chain to make this obvious at a glance.
You'll hear traders talk about three states of moneyness:
- In-the-Money (ITM): These options already have intrinsic value. That means if you exercised them this second, they’d be profitable. A call is ITM when the strike price is below the stock's current price. A put is ITM when the strike is above it.
- At-the-Money (ATM): These are the options with strike prices hovering right around the current stock price. They're on the knife's edge of having intrinsic value and are a major focal point for active traders.
- Out-of-the-Money (OTM): These options have zero intrinsic value. For a call, the strike is above the current stock price; for a put, it's below. Their entire price tag comes from time and implied volatility.
For anyone selling covered calls or cash-secured puts, OTM options are often the sweet spot. You're collecting premium for selling a contract that has a lower chance of being exercised against you, which is the core of that income strategy.
Choosing the right strike is a classic risk-vs-reward decision. A strike price far OTM might feel safer, but the premium you collect will be smaller. On the other hand, a strike closer to the money pays a much richer premium but comes with a higher risk of your option being exercised.
Nailing this trade-off is fundamental to successful trading, which is why we put together a whole guide on how to choose an option strike price that actually fits your specific goals.
Selecting an Expiration Date
The final piece of this puzzle is the expiration date. When you pull up an options chain, you'll see a whole menu of available dates. They can range from short-term weekly options that expire in just a few days to long-term contracts called LEAPS (Long-Term Equity Anticipation Securities) that can last for more than a year.
Your choice here completely changes the DNA of your trade:
- Weekly Options: These are for high-octane, short-term moves. They're cheaper but get eaten alive by time decay (theta), meaning their value evaporates incredibly fast.
- Monthly Options: This is a popular middle ground. They offer a decent balance between the premium you receive and the rate of time decay.
- LEAPS: Think of these as a long-term stock substitute. They are much more expensive, but their time decay is significantly slower, making them suitable for long-term strategies.
By learning to juggle strike price, expiration, and moneyness, you stop just reading numbers on a screen and start making genuinely strategic decisions. It's a practical skill that gives you the confidence to pick contracts that actually align with your view of the market and what you're willing to risk.
Gauging Market Conviction with Volume and Open Interest
If you really want to get a feel for what the market is thinking, you have to look beyond the bid/ask spread. Two of the most revealing columns on any options chain are Volume and Open Interest. They might sound similar, but they tell you two totally different—and equally vital—parts of the story.
I like to think of it like a popular restaurant. Volume is how many people walked through the door today. Open Interest is the total number of reservations on the books for the whole month. One tells you about today's buzz; the other reveals the total level of commitment.
- Volume: This is simple. It's the total number of contracts that changed hands for a specific strike price during the day. High volume means a lot of traders are active at that strike right now.
- Open Interest (OI): This shows the total number of contracts that are still active—meaning they haven't been closed, exercised, or expired. It's a running tally of all open positions.
A contract only gets counted toward Open Interest when a brand new buyer and a new seller come together to create a position. If a trader just sells an existing contract to someone else, the Volume ticks up by one, but Open Interest stays the same. This little detail is crucial for reading the market's true conviction.
Using Volume to Spot Unusual Activity
Think of volume as your real-time liquidity gauge. It tells you what's hot today. When you see a massive, out-of-the-blue spike in volume at a particular strike—especially one way out-of-the-money—that's a signal you can't ignore. It often means institutional "smart money" is placing a big, speculative bet.
Imagine a stock is trading at $50. Out of nowhere, 10,000 contracts trade on the $60 calls. That’s not normal. It strongly suggests a big player believes the stock is about to make a major move up. That data point alone can be powerful confirmation if you already have a bullish hunch.
Open Interest as Support and Resistance
While volume shows you today's action, Open Interest shows you where the money is parked for the long haul. Strikes with exceptionally high Open Interest often act like magnets for the stock price, turning into key support or resistance levels.
High Open Interest can become a self-fulfilling prophecy. For example, a strike with a huge amount of open put contracts can become a support level. As the stock price falls toward that strike, the market makers who sold those puts might start buying the stock to hedge their position, which helps prop up the price.
The scale here is massive. On a typical day, more than 21 million ETF option contracts are traded, which is about 36% of all daily options volume. This incredible flow of capital is what creates these significant OI levels. You can dig into these option volume trends to see just how much influence they have across the market.
When you start cross-referencing high volume with high Open Interest, you can build a much more solid case for a trade. If you find a strike that already has high OI and also sees unusually high volume for the day, it's a confirmation that new, active interest is piling into an already significant position. That combination is one of the clearest signs of market conviction you'll ever find on an options chain.
Beyond the strike price and expiration date, the real action is in an option's price. But what actually sets that price? It's a constant push and pull between what buyers are willing to pay, what sellers are willing to accept, and what everyone thinks the stock will do next.
To get good at reading an options chain, you have to become fluent in the language of the Bid, the Ask, and Implied Volatility (IV).
The Bid price is the most a buyer is offering for an option right now. The Ask is the lowest price a seller will take. The gap between them is called the Bid-Ask Spread, and you can think of it as the built-in cost of making the trade.
A tight spread is your best friend. It’s a sign of high liquidity, which means there are plenty of buyers and sellers circling. That makes it easy to get in and out of a trade at a fair price. On the flip side, a wide spread signals an illiquid option, where you might struggle to get your order filled without giving up a lot on the price.
Demystifying Implied Volatility
While the Bid-Ask spread shows you what's happening right now, Implied Volatility (IV) is all about the future. It’s easily one of the most powerful—and most misunderstood—metrics on the entire options chain.
IV isn't about what the stock did in the past. It’s the market's live forecast of how much the stock's price is expected to move over the life of the option, shown as an annualized percentage. High IV means the market is bracing for big, wild price swings. Low IV suggests everyone is expecting things to be pretty calm.
This "fear gauge" directly pumps up or deflates an option's extrinsic value. Higher IV means more expensive options because you’re paying a premium for the greater chance of a huge move. Lower IV means cheaper options.
A classic rookie mistake is buying an option without even glancing at the IV. You might buy a call on a stock right before earnings, be totally right about the direction, and still lose money. This is "IV crush" in action. Once the news is out, the uncertainty evaporates, IV tanks, and the value of your option can get hammered.
Using IV and the Greeks in Your Strategy
Knowing what IV is is the first step, but using it to your advantage is what separates the pros from the pack. It gives you a clear signal about which strategies might work best.
- When IV is high: Option premiums are inflated and expensive. This is usually a great time to be an option seller, using strategies like covered calls or cash-secured puts to collect that juicy premium. You're basically getting paid for the market's anxiety.
- When IV is low: Option premiums are cheap. This is often a better environment for buying options, as you can scoop up calls or puts at a discount.
To see how this plays out, let's look at a couple of scenarios.
Implied Volatility (IV) Scenarios
| Scenario | What It Means for Option Prices | Potential Strategy |
|---|---|---|
| High IV (e.g., before earnings) | Options are expensive; extrinsic value is high. | Sell options. Strategies like covered calls or credit spreads allow you to collect the inflated premium. |
| Low IV (e.g., quiet market period) | Options are cheap; extrinsic value is low. | Buy options. Strategies like long calls or long puts are less expensive, giving you more bang for your buck if you expect a move. |
As you can see, high IV and low IV environments call for completely different game plans.
This whole concept ties directly into the "Greeks," which are a set of risk metrics. One of the most important is Vega, which tells you how much an option's price will move for every 1% change in Implied Volatility. Options with high Vega are extremely sensitive to shifts in IV. Getting a firm grip on these relationships is the foundation of solid options risk management, helping you avoid overpaying for contracts and protecting your portfolio from sudden volatility shocks.
Putting It All Together with a Real-World Example
Alright, let's connect the dots. All those columns and metrics on an options chain can feel a bit abstract until you actually use them to pull the trigger on a trade. We're going to walk through a complete analysis, applying everything we've covered to a real-world trading scenario.
Imagine our trading goal is this: "I think stock XYZ, currently at $100, is going to trade flat or maybe creep up a little over the next month, and I want to generate some income from my shares." This is a classic setup for selling a covered call.
Defining Your Trade Parameters
First up, we need an expiration date that matches our one-month outlook. We'll pull up the options chain and zero in on an expiration that's about 30 days away. This gives our idea enough time to play out without getting chewed up by the rapid time decay you see in weekly options.
Next, we have to land on a strike price. Since we're looking for income and think the stock will be pretty stable, we'll focus on out-of-the-money (OTM) call options. A strike like $105 seems like a good candidate. It's above the current price, which gives the stock some breathing room to run up, and the premium we'll collect gives us a nice cushion if the stock dips.
This whole process is a simple, repeatable framework you can use every single time you're sizing up a potential trade.
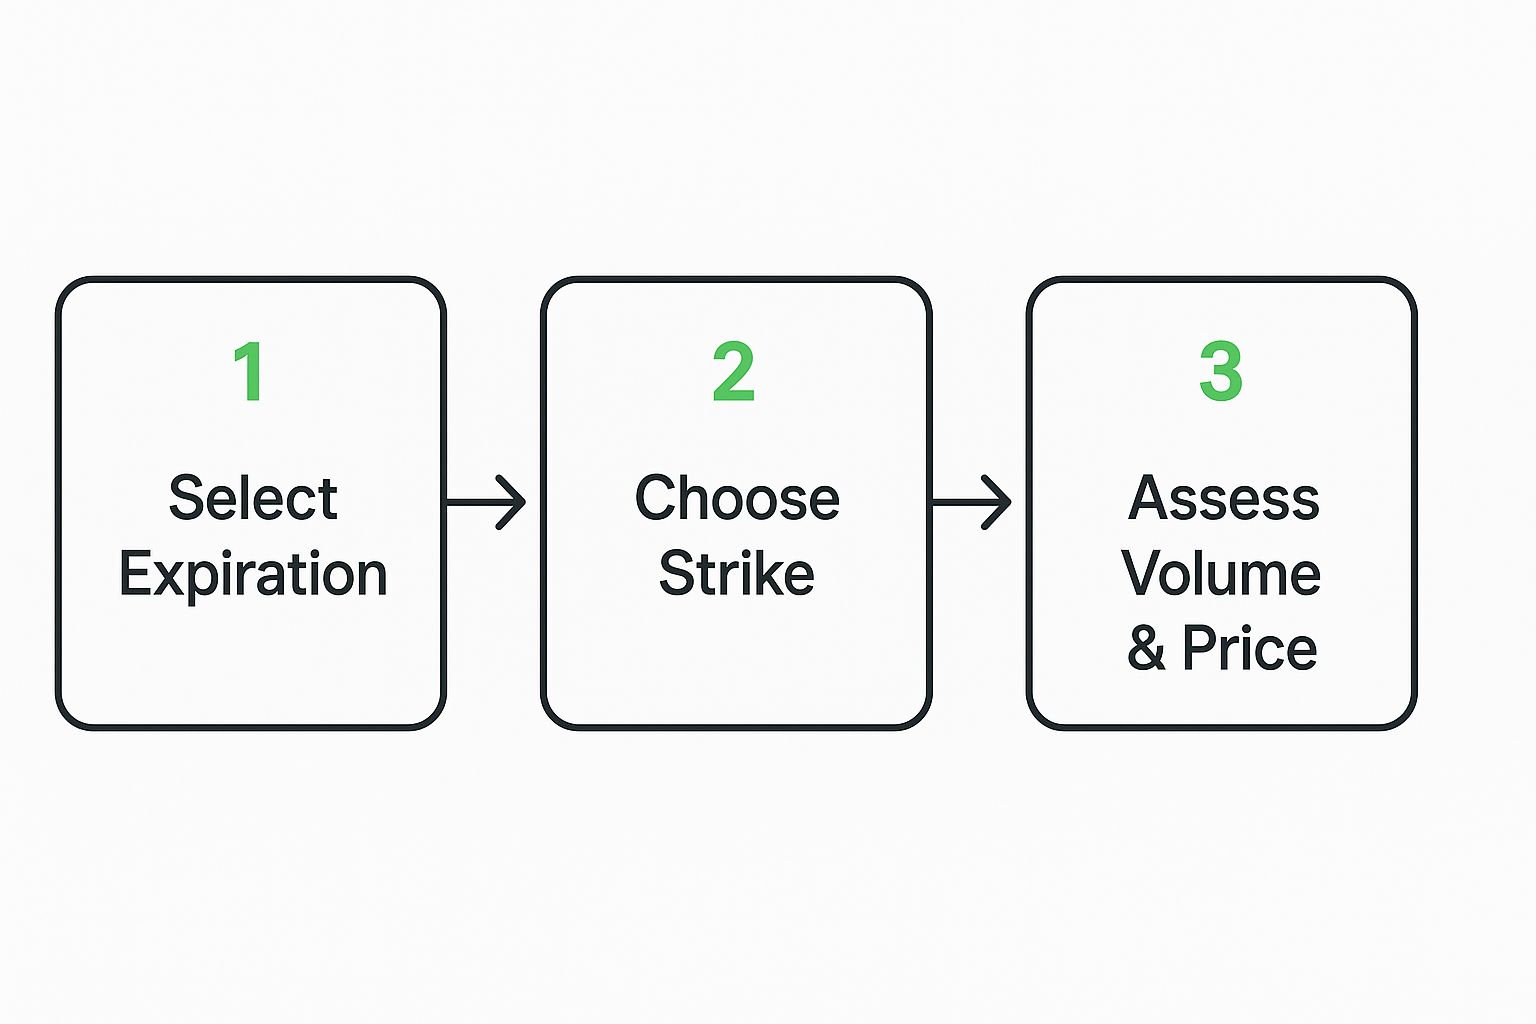
As you can see, reading an options chain really just boils down to a sequence of strategic decisions. You start with your timeline, move to your price target, and finish by checking what the market is telling you.
Finalizing with Data-Driven Confirmation
Now for the final check. We need to look at the key metrics for that $105 call to make sure we're not walking into a trap. We'll check the Volume and Open Interest. Healthy volume for the day, along with a solid open interest number, tells us that this specific contract is liquid. That's huge—it means we can get in and out of the trade easily without getting a terrible price.
Here's a key takeaway: always, always check for liquidity. A juicy premium on a contract with zero volume and low open interest is a mirage. You might get into the position, but good luck getting out.
Finally, we'll glance at the Implied Volatility (IV). Since we're selling the option, a higher IV is our friend because it inflates the premium we collect. If the IV seems unusually low for this stock, we might hit the pause button or look at a different strike.
By following this sequence—setting a goal, picking an expiration and strike, and then confirming with volume and IV—we've used the options chain to build a logical trade. This methodical approach is exactly what our guide on the covered call strategy breaks down, turning that complex grid of numbers into a clear, actionable plan.
A Few Common Questions I Always Get
Even after you get the hang of the individual columns, a few questions seem to pop up for just about everyone. Getting clear, actionable answers to these common sticking points is how you build real confidence when you're learning to read an option chain. Let's tackle the most frequent ones head-on.
What's the Real Difference Between Volume and Open Interest?
This is probably the most common point of confusion, but it's simpler than it looks.
Think of it this way: Volume is like the number of people who bought tickets for a concert today. Open Interest is the total number of seats sold for the entire show, including all the tickets sold yesterday and the day before.
Volume tells you what's hot right now and how easy it is to get in and out of a trade. Open Interest shows you the total scale of the position—how many contracts are still open and waiting to be closed or expire.
So what does this mean for your trading?
- A contract with high volume but low open interest often means lots of day traders are jumping in and out.
- High open interest, on the other hand, suggests a more significant, longer-term commitment from the market.
The most powerful signal is when you see a sudden, massive spike in volume on a contract that already has high open interest. It’s a clear sign that new, big money is flooding into a position the market already cares about. That often means a big move is on the horizon.
How Do I Pick the Right Expiration Date?
There’s no single "best" expiration date; it all comes down to your strategy and your forecast for the stock. Choosing an expiration is always a trade-off between how much you pay and how much time you're buying yourself.
Here's a simple framework I use to guide my decisions:
- Short-Term Speculation (1-4 weeks out): If you're expecting a quick, sharp move from something like an earnings report, this is your zone. These options are cheaper, but be warned: their value decays incredibly fast. Time is not on your side here.
- Swing Trading (30-90 days out): This is the sweet spot for many traders, myself included. It gives your thesis enough time to actually play out without the brutal time decay you see with weekly options.
- Long-Term Positions (6+ months out): If you're looking to replace a stock position or make a long-term directional bet, you'll want to look at LEAPS (Long-Term Equity Anticipation Securities). They're more expensive, but they also behave much more like the underlying stock.
Why Is the Bid-Ask Spread So Wide on Some Options?
A wide gap between the bid and ask price is almost always a giant red flag for one thing: poor liquidity. It’s the market’s way of telling you that there aren't many buyers and sellers actively trading that specific contract.
You'll see this most often with options that are way out-of-the-money or have very distant expiration dates. When liquidity is that low, market makers widen the spread to protect themselves from the risk of getting stuck with a position they can't easily offload.
Trading these options means you instantly lose more on the "cost" of the trade itself, which makes it that much harder to turn a profit. My advice? Always favor options with a tight, competitive spread.
Ready to stop guessing and start making data-driven decisions? Strike Price provides real-time probability metrics for every strike, helping you balance safety and premium. Ditch the analysis paralysis and let our platform find high-reward opportunities and warn you of risks before they happen. Join thousands of traders earning consistent income at https://strikeprice.app.