Options Volume vs Open Interest A Guide for Smarter Trades
If a stock moves past your strike, the option can be assigned — meaning you'll have to sell (in a call) or buy (in a put). Knowing the assignment probability ahead of time is key to managing risk.
Posted by
Related reading
A Step-by-Step Covered Calls Example for Consistent Income
Unlock consistent income with our step-by-step covered calls example. This guide breaks down the strategy, risks, and outcomes to help you trade confidently.
Long Call and Short Put The Ultimate Synthetic Stock Guide
Unlock the power of the long call and short put strategy. This guide explains how synthetic long stock works, its benefits, risks, and how to execute it.
What is a Call Spread? A Clear Guide to Bull and Bear Spreads
What is a call spread? Discover how bull and bear spreads limit risk and sharpen your options trading strategy.
The real difference between options volume vs. open interest boils down to this: volume tells you about today's action, while open interest reveals the market's ongoing commitment.
Volume is a measure of the day’s hustle—how many contracts changed hands. It resets to zero every morning. Open interest is the cumulative total of all contracts that are still active and haven't been closed, exercised, or expired.
Defining the Core Metrics of Options Trading
To build a solid income strategy, you have to get a feel for the data points that show what the market is actually doing. Volume and open interest are two of the most important metrics, but they tell completely different stories about an option’s life. Mixing them up is a classic mistake that leads to bad trade choices and missed chances.
Here's a simple way to think about it. Imagine a popular restaurant. Volume is the number of people who walked in and out the door today. It's a snapshot of the day's traffic. Open interest, on the other hand, is the total number of reservations on the books for the next few weeks. One shows immediate buzz; the other shows sustained, forward-looking interest.
What Is Options Volume?
Volume is just the total number of contracts traded for a specific option during a single trading session. It’s a direct measure of current activity and, more importantly, liquidity.
- Real-Time Indicator: Volume updates constantly throughout the day, giving you an immediate pulse on market interest.
- Liquidity Gauge: High volume is your friend. It usually means an option is liquid, making it much easier to get in and out of a trade at a fair price with a tight bid-ask spread.
- Activity Snapshot: It counts every single transaction—whether it opens a new position, closes an old one, or is just a quick day trade—and resets to zero when the next trading day begins.
What Is Open Interest?
Open interest (OI) represents the total number of options contracts that are currently active or "open." These are contracts that have been bought or sold but haven't been closed out, exercised, or expired yet.
- Cumulative Data: Unlike volume, OI is a running total. It’s calculated once per day after the market closes.
- Market Conviction: A rising OI suggests new money is flowing into the market, which can signal growing conviction behind a particular price move or trend.
- Position Indicator: OI only changes when a brand new contract is created between a buyer and a seller, or when an existing contract is officially closed. If two traders just swap an existing contract between themselves, the total OI doesn't change at all.
To make it even clearer, here's a quick breakdown of how these two metrics stack up against each other.
Key Differences Volume vs Open Interest
| Metric | What It Measures | Timeframe | Key Signal |
|---|---|---|---|
| Volume | Total contracts traded | Daily (resets to zero) | Liquidity & intraday activity |
| Open Interest | Total unsettled contracts | Cumulative (updates overnight) | Market conviction & participation |
Ultimately, these two metrics are just pieces of a larger puzzle. Getting a full picture requires digging into other foundational concepts like the option trading greeks and understanding market volatility. While volume shows you what's hot right now, open interest gives you a sense of the market's underlying commitment.
The Relationship Between Volume and Open Interest
While options volume and open interest each tell a distinct story, their true power comes alive when you analyze them together. The interplay between these two metrics reveals the market's underlying conviction and momentum. It's the difference between hearing a single shout and hearing a growing chorus; one is momentary noise, while the other signals a real shift in sentiment.
Thinking of them as separate data points is a common mistake. You should really view them as a dynamic pair that answers one critical question: is today's trading activity driven by new money entering the market, or is it just old positions being closed out? Getting this right is how you distinguish between a sustainable trend and a temporary price blip.
This flowchart lays out a simple decision-making framework based on how volume and open interest interact.
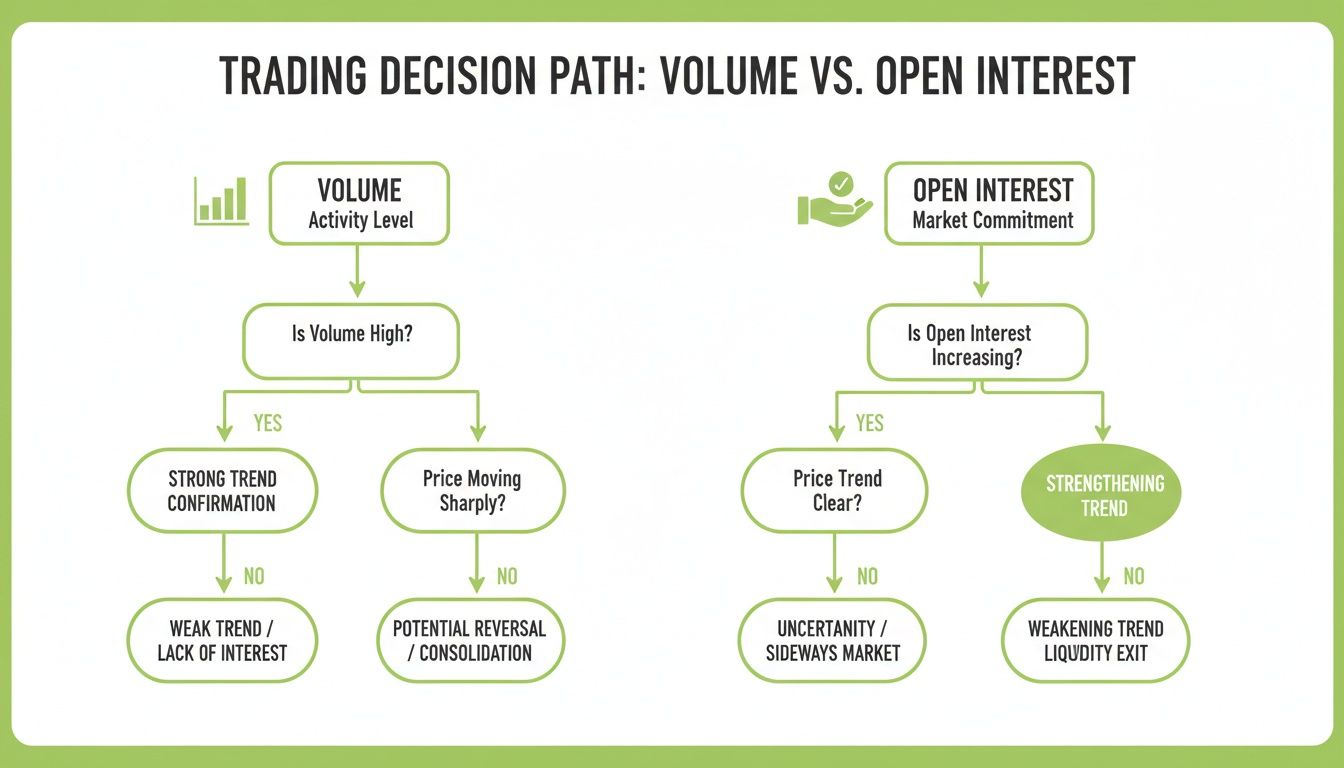
As you can see, rising numbers for both metrics point to the strongest conviction. Declining or mixed signals, on the other hand, suggest waning interest or that a trend is running out of steam.
Four Critical Market Scenarios
By observing how volume and open interest change relative to each other—and the underlying stock price—we can identify four primary scenarios. Each one gives us a unique signal about what the market is thinking.
High Volume + Rising Open Interest: This is the most powerful signal of a strong, healthy trend. New money is aggressively entering the market, and traders are confident enough to hold their positions overnight. Whether the stock is rising (bullish) or falling (bearish), this combination confirms there’s strong conviction behind the move.
High Volume + Falling Open Interest: This pairing often signals a potential trend reversal or exhaustion. The high volume shows plenty of activity, but the drop in open interest means traders are closing out their positions instead of opening new ones. This could be profit-taking at the end of an uptrend or short-covering at the bottom of a downtrend.
Key Takeaway: When you see high volume but falling open interest, it suggests the fuel for the current trend is running out. The smart money may be heading for the exits.
Low Volume + High Open Interest: This indicates a period of quiet conviction. While there isn't much new action, existing position holders are content to maintain their contracts. The market is essentially in a "wait and see" mode, and the current trend might just be pausing before its next move.
Low Volume + Low Open Interest: This simply signals disinterest. Traders are neither entering nor actively holding positions in this particular option. It tells you there's a lack of conviction and probably poor liquidity, making it a difficult—and often risky—environment to place new trades.
A key historical pattern across major U.S. exchanges shows that on high-volume days, open interest often lags, reflecting a surge in day trading rather than new long-term positions. For example, historical data from 2019 reveals that during peak volatility, average daily equity options volume spiked to over 40 million contracts, yet open interest grew by only 15-20% month-over-month. This suggests roughly 70-80% of the volume represented closing or intraday trades. To see more historical patterns, you can explore Cboe market statistics.
Using Volume and Open Interest for Income Strategies
Let's move from theory to practice. This is where income traders find their edge. For those of us selling covered calls and cash-secured puts, volume and open interest aren't just numbers on a screen. They’re direct signals that help fine-tune strike selection, nail down timing, and manage risk.
When you understand how these two metrics reflect what the market is thinking, you stop guessing and start making probability-driven decisions. This is especially true for income strategies, where the goal isn't to bet on a stock's direction but to collect premium. You're really just taking a stance on where you believe the stock price won't go.
Volume and open interest give you critical clues about the conviction behind potential price moves, helping you steer clear of strikes that are likely to get challenged.

Covered Call Strategy Insights
When you write a covered call, your ideal outcome is for the option to expire worthless. You keep the premium, and your shares don't get called away. High volume is a must—it means there's enough liquidity to get in and out of the trade at a fair price. But it's the open interest trend that truly tells you about the risk of assignment.
The sweet spot for a covered call seller is often high volume paired with flat or declining open interest. This mix suggests that even with a lot of trading activity, new money isn't piling in to bet on a big upward move. That high volume could just be traders closing old positions or day trading, not building a base of bullish conviction that could send the stock soaring past your strike.
Key Takeaway for Covered Call Sellers: Look for liquidity (high volume) without strong directional conviction (flat or falling open interest). That combo often points to options where you can collect a solid premium with a lower chance of having your shares assigned.
Historical data backs this up. Volume often runs way ahead of open interest, especially around big news. In Q4 2023, for instance, the U.S. equity options market saw total volume hit 2.5 billion contracts, while open interest was closer to 800 million. That gap shows just how much trading is short-term noise, not new, long-term conviction.
Cash-Secured Put Strategy Insights
For cash-secured put sellers, the goal is a bit different. You collect premium knowing you might be assigned the shares at the strike price—a price you've already decided you're happy to own the stock at. For you, a rising open interest at strikes below the current stock price can be a powerful, positive signal.
When you see a huge buildup of open interest at a specific put strike, it’s often a sign that a lot of traders see that price as a solid support level. This "wall of puts" can act as a floor, since so many people have effectively agreed to buy the stock at that price. This collective interest can give you more confidence when selling a put at or near that strike. To dive deeper into how market dynamics can be interpreted, exploring common options trading strategies can be a good next step.
Of course, to really apply this, you need a solid grasp of the mechanics of shorting put options and how it fits with your overall portfolio goals.
To make this easier to digest, here's a quick guide on how to read these market signals for both strategies.
Strategic Signals for Options Sellers
This table breaks down how to interpret volume and open interest signals when selling options for income.
| Market Signal | Implication for Covered Call Sellers | Implication for Cash-Secured Put Sellers |
|---|---|---|
| High Volume + Rising OI | Caution: Strong bullish conviction is building, increasing assignment risk. | Positive: Could signal a bottoming process, but wait for confirmation. |
| High Volume + Falling OI | Ideal: High liquidity for trading, but conviction is weakening, lowering assignment risk. | Caution: Traders are exiting long puts, which could signal a trend reversal. |
| Rising OI at Specific Strike | Warning: A call strike with high OI may act as a resistance level, but a breach could be powerful. | Opportunity: A put strike with high OI may act as a strong support level. |
By keeping these signals in mind, you can better align your covered call and cash-secured put trades with the underlying market sentiment, giving you a smarter, more data-driven approach to generating income.
Practical Scenarios for Interpreting Market Data
Knowing the textbook definitions of options volume and open interest is one thing. Translating that data into actionable intelligence is what separates consistently profitable options sellers from everyone else. When you learn to apply these metrics to real-world market events, abstract numbers suddenly become a clear roadmap.
Let's walk through three common scenarios. In each one, we'll break down how to interpret the data flow to spot high-probability setups, sidestep dangerous traps, and sharpen your timing for entries and exits.
Scenario 1: The Pre-Earnings Ramp-Up
Earnings season is a goldmine for income sellers. The spike in implied volatility pumps up option premiums, but it also brings the risk of wild, unpredictable price swings.
Picture a popular tech stock reporting earnings next week. You notice a huge jump in both call and put volume a few days out. At the same time, open interest at several out-of-the-money (OTM) strikes starts to climb.
- Data Interpretation: The high volume is your first clue—it signals a frenzy of speculative activity. But the rising open interest is what confirms this isn't just day-trader noise. New money is flowing in as traders place their bets on the earnings outcome. This combination points to growing conviction.
- Strategic Action for an Options Seller: This is a premium-rich environment. A covered call seller could use this as a chance to sell calls at a higher strike than usual, grabbing that fat premium from the inflated volatility. A cash-secured put seller might sell a put at a strike they believe is a solid support level, knowing the high premium offers a nice cushion for the risk. The rising open interest is the key here; it tells you a real buildup of positions is happening.
Scenario 2: Post-Announcement Profit Taking
Now, fast forward to the day after the earnings report. The company crushed expectations, and the stock gapped up big at the open.
You see extremely high trading volume, especially in the call options that are now deep in-the-money. But when you check the data the next day, you notice open interest in those same calls has plummeted.
- Data Interpretation: The high volume just reflects the market’s immediate reaction. The critical piece of the puzzle is the falling open interest. It tells you that most of yesterday's volume was from traders closing their winning call positions to lock in profits. New buyers weren't piling in; existing holders were cashing out.
- Strategic Action for an Options Seller: This is a flashing sign that the initial explosive move might be running out of gas. If your covered call strike was breached, this is a moment to pause and let things stabilize before deciding to roll. If you're looking to open a new position, this signals it might be smart to wait for the profit-taking to cool off, as the stock could drift sideways or even pull back.
Scenario 3: Strong Trend Confirmation
Let's look at a stock that's been stuck in a boring, tight range for weeks. Finally, it breaks out above a key resistance level with strong, convincing price action.
In the days following the breakout, you see that both trading volume and open interest are steadily rising, particularly for call options just above the new stock price.
Key Insight: When volume and open interest rise together in the direction of a price move, it confirms that new capital is flowing in to support the trend. This is not a false breakout; it's a move backed by market conviction.
- Data Interpretation: The rising volume shows strong interest in the breakout. The increasing open interest confirms that traders are opening new long positions, betting the upward move will continue. This synergy is a powerful confirmation signal. Part of this analysis also means understanding how orders get filled, which you can learn about in our guide on what the bid-offer spread is in trading.
- Strategic Action for an Options Seller: For a covered call seller, this is a major warning. Writing a call too close to the current price is asking for trouble, as the strong upward momentum makes assignment much more likely. A cash-secured put seller, on the other hand, might see this as a bullish signal, feeling more confident selling puts below the breakout level and using the new trend as a tailwind.
Common Mistakes When Analyzing Volume and Open Interest
Understanding the relationship between options volume and open interest is a powerful tool, but it's also where traders frequently make expensive errors. These metrics seem simple on the surface, but their nuances can easily lead you to the wrong conclusion if you're not careful.
Knowing these common pitfalls is the first step to avoiding them and protecting your capital.
Mistaking All High Volume for New Interest
This is probably the most frequent mistake I see. A trader spots a massive spike in call volume and immediately assumes a bullish frenzy is kicking off. But without checking the change in open interest, that assumption is completely blind.
That surge could just be traders closing out existing positions to lock in profits after a stock's run-up. If that’s the case, it’s actually a signal that the move might be running out of steam—the exact opposite of what the volume spike suggested.
The core of this error is failing to ask: "Where is this volume coming from?" High volume just tells you a lot of contracts changed hands. It doesn't tell you if those trades created new positions or just settled old ones.
- The Pitfall: A stock jumps 5%, and call volume for a nearby strike is 10 times its daily average. A trader buys calls, thinking the rally has legs.
- The Reality: The next day, open interest for that strike has dropped. The high volume was just profit-taking. The stock stalls out, and the trader's new call position bleeds value from time decay.
- The Solution: Always cross-reference high volume with a matching rise in open interest. If both are climbing together, it’s a strong sign that new money is entering the market and backing the trend.
Trader's Rule of Thumb: Volume shows the day's excitement; open interest reveals the market's overnight commitment. Never trust one without checking the other.
Exchange data backs this up. One compelling insight from the major exchanges is how extreme volume surges without open interest support often precede 15-25% reversals in the underlying stock. For instance, reports from 2021's wild market swings showed net open interest changes as low as 5% even when daily volume doubled to 30 million contracts. Those high-volume, low-OI days frequently led to significant pullbacks within two weeks.
For covered-call sellers, this is a data-driven edge. You can dig into this kind of data yourself over at CME Group's market data archives.
Ignoring the Implications of Low Open Interest
Another critical mistake is getting drawn to options with low open interest, usually because the premium looks juicy. Low open interest is almost always a red flag for poor liquidity.
Fewer market participants means a wider bid-ask spread. When you try to enter a trade in an illiquid option, you can get hit hard on both the entry and the exit, often having to accept a much worse price than you planned for.
Failing to Analyze Data in Context
Finally, the biggest flaw is looking at volume and open interest in a vacuum. These numbers are meaningless without the context of price action and what's happening in the market.
- Price Action: Is the stock in a clear trend, stuck in a range, or trying to reverse? A spike in call volume and open interest is far more meaningful if the stock just broke through a long-term resistance level.
- Market Events: Is there an earnings report coming up? An FDA announcement? A major economic data release? These events create temporary flurries of volume that often have nothing to do with long-term conviction.
By always layering your analysis of options volume vs open interest with price action and the broader market narrative, you graduate from simply reading numbers to truly understanding market sentiment. It's this complete picture that leads to consistent, informed trading decisions.
Putting It All Together in Your Trading Workflow
Theory is great, but making consistent money comes from turning that knowledge into a repeatable daily process. A structured workflow is what separates systematic, probability-driven traders from those just chasing random data points. The goal isn't to replace your entire strategy, but to layer this analysis on top to sharpen your decisions.
Your workflow should kick in right at the start, during your initial trade screening. Let's say you find a stock offering a juicy premium for a covered call or cash-secured put. Before you do anything else, check its liquidity. Is the daily volume high enough to guarantee a tight bid-ask spread? An option with a big premium but only 50 contracts traded all day is usually a trap—you'll get killed on the fills, both getting in and getting out.
Building a Quick Mental Checklist
Once you've confirmed there's enough liquidity to trade, it's time to gauge the market's conviction. This is where the interplay between volume and open interest really shines.
- Scan for High Volume: First, find the action. Use your trading platform or a tool like Strike Price to filter for options with higher-than-average daily volume. This gives you a pool of liquid candidates worth looking at.
- Check Open Interest Trends: For each one, pull up the open interest. Is it climbing, dropping, or just sitting there? A rising OI paired with high volume is a powerful confirmation that new money is flowing in, signaling a real trend you need to pay attention to.
- Ask Why: Finally, add some context. Why is this happening now? Is there an earnings report around the corner? A big news event? A technical breakout on the chart? This final step helps you figure out if the activity is just short-term speculative noise or a sign of sustained conviction.
Using Modern Tools to Your Advantage
Let's be honest, screening every option manually is a grind. Platforms designed for options sellers can automate a lot of this heavy lifting. A good dashboard, for example, can show you high-premium opportunities that already meet your liquidity and volume thresholds, saving you a ton of time.
Here's an example of a dashboard that helps you spot and monitor trades efficiently.
By putting key metrics like premium, probability, and volume all in one place, tools like this let you run through your analytical checklist in seconds. You can instantly see if a high-premium option also has the trading activity to support a healthy trade. It turns raw data into an actionable decision, right when you need it.
Ultimately, this whole process is about building a smarter filter. By first checking volume for liquidity, and then analyzing its relationship with open interest for conviction, you're adding a powerful layer of validation to your trading. It's a disciplined approach that helps you sidestep illiquid traps, avoid trades with bad risk dynamics, and consistently find stronger, higher-probability positions for your portfolio.
Frequently Asked Questions
When you're trying to nail down options volume vs. open interest, a few questions always seem to pop up. Let's clear the air and get you some straight answers.
Which Is More Important for an Options Seller: Volume or Open Interest?
It's a classic question, but there's no single winner. Think of it less like a competition and more like a partnership. Each one tells you something different, and you need both parts of the story.
High volume is your ticket to the game. It’s all about liquidity. High volume means you can get in and out of a trade smoothly, with a tight bid-ask spread. Without it, you could find yourself stuck in a position or taking a big loss just to close it out.
Open interest, on the other hand, is about market conviction. This number tells you how many contracts are still active and haven't been closed. It shows you where the real money is sitting and whether traders are opening new bets or cashing out of old ones.
For an options seller, high volume is non-negotiable—it's what makes a trade even possible. But it's the interplay between volume and open interest that gives you a real edge. Volume gets you in the door; open interest tells you what's happening inside the room.
How Often Does Open Interest Data Update?
This is a huge difference between the two. Volume is real-time. You can literally watch it tick up throughout the day as trades happen. It gives you an immediate feel for the day's action.
Open interest is the opposite. It’s calculated only once per day, after the market closes. The exchanges add up all the new contracts and subtract all the closed ones to give you a final number for the next morning. So, it’s a lagging indicator—it confirms what happened yesterday, not what's happening right now.
Can Big Players Manipulate Volume and Open Interest?
"Manipulation" is a strong word, but can big institutions move the numbers? Absolutely. A massive hedge fund rolling a huge position or a pension fund putting on a major hedge can cause massive spikes in both volume and open interest.
But these moves rarely fool a trader who's paying attention to the context. A sudden explosion in volume without a matching price move, or a jump in open interest that doesn't fit the current trend, usually smells like institutional paper shuffling, not widespread speculation.
By always looking at the price action and what's happening in the broader market, you can learn to spot the difference between these technical flows and a real shift in market sentiment.
Ready to stop guessing and start trading with an edge? Strike Price cuts through the noise with real-time alerts and a dashboard that surfaces these critical signals for you. Make data-driven decisions to boost your premium income. See how at https://strikeprice.app.