A Trader's Guide to Probability of Profit Options
If a stock moves past your strike, the option can be assigned — meaning you'll have to sell (in a call) or buy (in a put). Knowing the assignment probability ahead of time is key to managing risk.
Posted by
Related reading
A Step-by-Step Covered Calls Example for Consistent Income
Unlock consistent income with our step-by-step covered calls example. This guide breaks down the strategy, risks, and outcomes to help you trade confidently.
Long Call and Short Put The Ultimate Synthetic Stock Guide
Unlock the power of the long call and short put strategy. This guide explains how synthetic long stock works, its benefits, risks, and how to execute it.
What is a Call Spread? A Clear Guide to Bull and Bear Spreads
What is a call spread? Discover how bull and bear spreads limit risk and sharpen your options trading strategy.
Ever wished you could quickly size up the odds of an options trade before you put your money on the line? That's exactly what Probability of Profit (POP) does. It's your statistical edge, boiled down to a single number that tells you the likelihood a trade will make at least $0.01 by expiration.
Think of it like a weather forecast for your portfolio. It gives you the odds of a profitable outcome, but it can’t predict a sudden market storm. It’s a powerful first-glance metric that helps you filter out trades that don't fit your risk tolerance.
Decoding Your Statistical Edge in Trading
Instead of drowning in complex analysis for every single trade idea, POP gives you a simple percentage. This number is your shortcut to understanding the statistical chance that your position will be profitable by the time it expires. It’s calculated using the strike price, the stock's current price, implied volatility, and the time left on the clock.
In today's fast-moving financial markets, which are constantly being reshaped by innovations in the broader Fintech industry, understanding concepts like POP is more critical than ever for staying ahead.
How POP Simplifies Decision-Making
Imagine you're counting cards at a blackjack table. You don't know for sure what the next card will be, but you're using probabilities to stack the odds in your favor over the long haul. POP works the same way for traders, empowering you to make data-driven decisions instead of just going with your gut.
Here’s how it helps you make smarter choices:
- Quick Filtering: You can instantly toss out trades that don't meet your personal threshold. If you only take trades with an 80% chance of success, anything with a 65% POP is a hard pass.
- Strategy Alignment: It helps you match a trade to your market outlook. High POPs often line up with income-focused strategies, while a lower POP might be perfectly fine for a high-reward directional bet.
- Risk Assessment: A low POP is an immediate red flag. While it's not a complete risk management tool, it tells you that a trade is riskier and prompts you to look closer at what could go wrong.
At its core, Probability of Profit translates complex market data into a single, digestible percentage. It answers the fundamental question every trader asks: "What are my chances of making money on this?"
Ultimately, POP is a foundational tool. It sets the stage for deeper analysis, but it's just one piece of the puzzle. A high POP doesn't mean zero risk, and it definitely doesn't tell you how much you could win or lose. The real power comes from using it as a starting point within a solid, well-defined trading plan.
How to Calculate Probability of Profit
So, how do you actually figure out the probability of profit on an options trade? It’s less about a single, rigid formula and more about a spectrum of methods, from quick mental math to the sophisticated models humming away inside trading platforms.
At the end of the day, every approach tries to answer the same question: What are the statistical chances this trade will make money by expiration?
The fastest way to get a rough idea is by looking at an option's Delta. Delta, one of the main "Greeks," tells you how much an option's price should move for every $1 change in the stock. But it also doubles as a surprisingly handy proxy for the probability of an option expiring in-the-money (ITM).
For example, a call option with a Delta of 0.30 has a rough 30% chance of finishing in-the-money. It’s a great tool for a quick gut check when you're scanning for opportunities.
This concept map shows how POP fits into a trader's decision-making process.
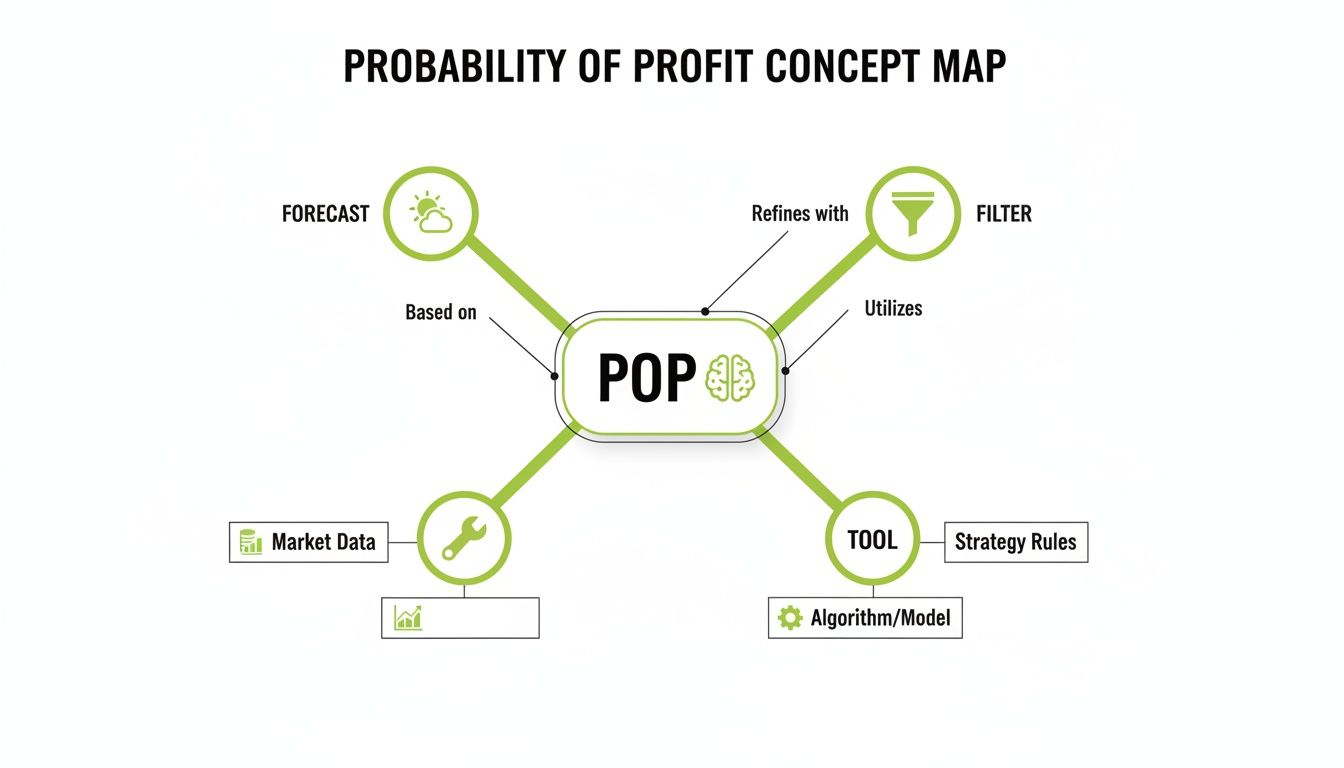
As you can see, POP isn't just a number—it’s a forecast, a filter, and a fundamental tool all rolled into one.
Moving Beyond Simple Estimates
Delta is a solid starting point, but it's not the whole story. Why? Because it only estimates the probability of expiring ITM by a single penny. It doesn’t account for the premium you paid. To actually be profitable, the option’s value has to climb high enough to cover your initial cost.
This is where the more powerful calculations come in. Modern trading platforms don't just use Delta; they run complex models, often built on the Nobel Prize-winning Black-Scholes framework, to give you a much more accurate probability of profit figure.
These models are constantly crunching several key variables:
- Implied Volatility (IV): This is the market’s best guess on future price swings. Higher IV means a wider range of possible outcomes, which directly shapes your profit probabilities.
- Time to Expiration (Theta): More time on the clock gives the stock more chances to move into your profitable zone. As that time decays, your probabilities will shift.
- Strike Price vs. Stock Price: The gap between your strike and the current stock price is a huge factor. An option that’s already in-the-money naturally has a higher POP than one that’s way out-of-the-money.
By feeding these inputs into their algorithms, an option probability calculator delivers a much cleaner and more reliable estimate than a quick Delta check ever could.
The Math Behind the Models
The two most common methods for calculating POP are the Delta approximation and the more precise model-based calculations found in trading software. Each has its place in a trader's toolkit.
Here’s a quick comparison of the different ways to think about POP calculations.
Comparing POP Calculation Methods
| Calculation Method | Accuracy | Ease of Use | Key Inputs |
|---|---|---|---|
| Delta Approximation | Low-Medium | Very Easy | Option's Delta |
| Statistical Modeling | High | Easy (via platform) | Volatility, Time, Price |
| Monte Carlo Simulation | Very High | Complex (platform-based) | Volatility, Time, Price, Drift |
As the table shows, while Delta is great for quick scans, the statistical models used by platforms provide a far more reliable figure for making final trade decisions.
So, how do these platforms actually crunch the numbers? One common approach is to use historical data to build a statistical forecast. They might look at a year of past returns and find that a stock landed in a specific price range 18 times out of 230 trading days, giving it a historical probability of 7.8%.
Other models take it a step further, running thousands of simulations of potential price paths the stock could take between now and expiration. They then count what percentage of those simulations end up profitable to arrive at the POP you see on your screen.
No matter the method—from a quick Delta check to a complex simulation—the goal is always the same: to quantify the chances of a stock price finishing within a profitable range by expiration. This gives you a data-driven edge.
Understanding both the back-of-the-napkin math and the robust platform calculations gives you a much deeper feel for this metric. It lets you filter opportunities quickly, then confirm your ideas with more precise data for more confident, informed trading.
Putting POP into Practice with Trading Strategies
Knowing what POP is is one thing. Actually weaving it into your trading routine is where you start to see the real difference. The probability of profit options metric isn't just another number on the screen; it's a strategic filter that helps you line up your trades with how you see the market and how much risk you're willing to take.
For different traders, POP plays a different role. Someone focused on steady income from covered calls might not even look at a trade unless it has an 80% POP or better. On the other hand, a trader making a bold directional bet might be perfectly happy with a 40% POP, knowing the potential reward is much bigger if they're right.
This is how POP goes from being a passive stat to an active part of your decision-making. It helps you put a number on your confidence and point your capital toward trades that have the odds in your favor.
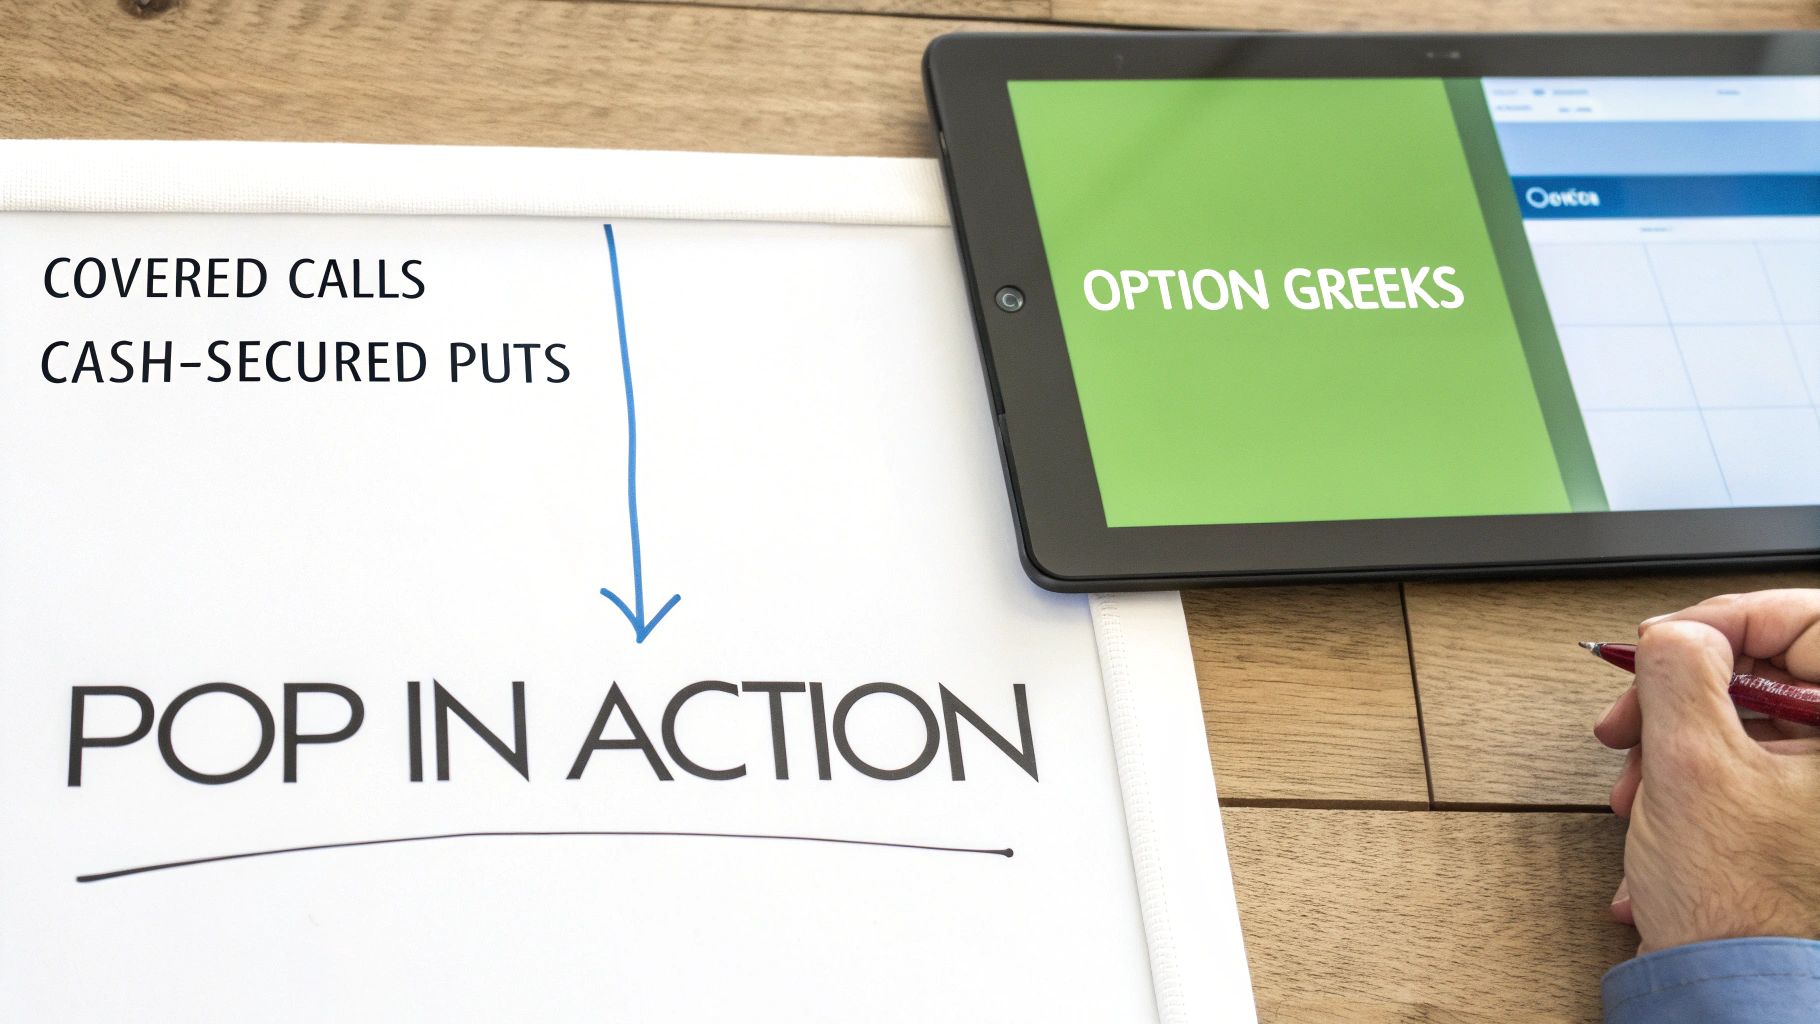
High POP Strategies for Income Generation
If your goal is to generate consistent income, high-probability strategies are your bread and butter. The plan isn’t to hit home runs; it's to get on base over and over again by collecting premium. Two of the most reliable ways to do this are with covered calls and cash-secured puts.
When you sell a cash-secured put, you’re essentially getting paid to agree to buy a stock at a lower price if it drops. By picking a strike price that's comfortably below where the stock is trading now, you can stack the odds in your favor and lock in a high POP.
Let's walk through a quick example:
- Stock: XYZ Inc. is trading at $100 per share.
- Your Goal: You want to collect some premium and you wouldn't mind owning XYZ if it dipped to $90.
- The Trade: You sell a cash-secured put with a $90 strike price that expires in 30 days.
Your trading platform tells you this trade has an 85% probability of profit. That means there’s a statistical 85% chance that XYZ will finish above $90 when the option expires, letting you pocket the entire premium you collected. If you want to see how traders build more complex positions, check out our guide on what is an option spread.
The core idea behind high-POP income strategies is to let time decay and probabilities work for you, not against you. You're basically betting that the stock will not make a big, surprise move against your position.
This approach is a perfect match for a more conservative, income-focused mindset. You’re trading massive potential gains for smaller, more frequent wins that have a much higher chance of success.
How Stable Is POP Over Time?
A fair question many traders ask is whether the POP they see at the start of a trade holds up as time passes and the market moves around. You'd think its predictive power would fade pretty quickly.
But the data tells a different story. A massive study looking at over 1 million options trades found that the calculated Probability of Profit is surprisingly stable for the entire life of the trade. Researchers used Brier scores to check for accuracy and found no major drops in the quality of the forecast from the day the trade was opened to the days leading up to expiration. This means the POP you see upfront remains a reliable guide. You can dig into the details of this option profit probability research yourself.
That stability is huge. It gives traders the confidence that their initial analysis wasn’t just a lucky snapshot but a durable statistical edge they can lean on. It confirms that using POP as a core metric for picking and managing trades is a sound practice.
Balancing High Probabilities with Smart Risk Management
A high probability of profit can feel like a green light, but it’s crucial to look both ways before hitting the gas. A 90% POP might look like a sure thing, but that single number tells you nothing about how much you stand to win—or, more importantly, lose. It’s a measure of likelihood, not a guarantee of safety.
The most tempting high-probability trades often carry a hidden danger: a completely lopsided risk-reward profile. Think about selling a call option way, way out-of-the-money. The statistical chance of the stock soaring past your strike is tiny, giving you a sky-high POP. But the premium you collect is equally small.
This is the classic scenario traders call "picking up pennies in front of a steamroller." You can successfully collect those small premiums over and over. But the one time you're wrong, the steamroller of a massive, unexpected market move can wipe out all those small gains and then some.
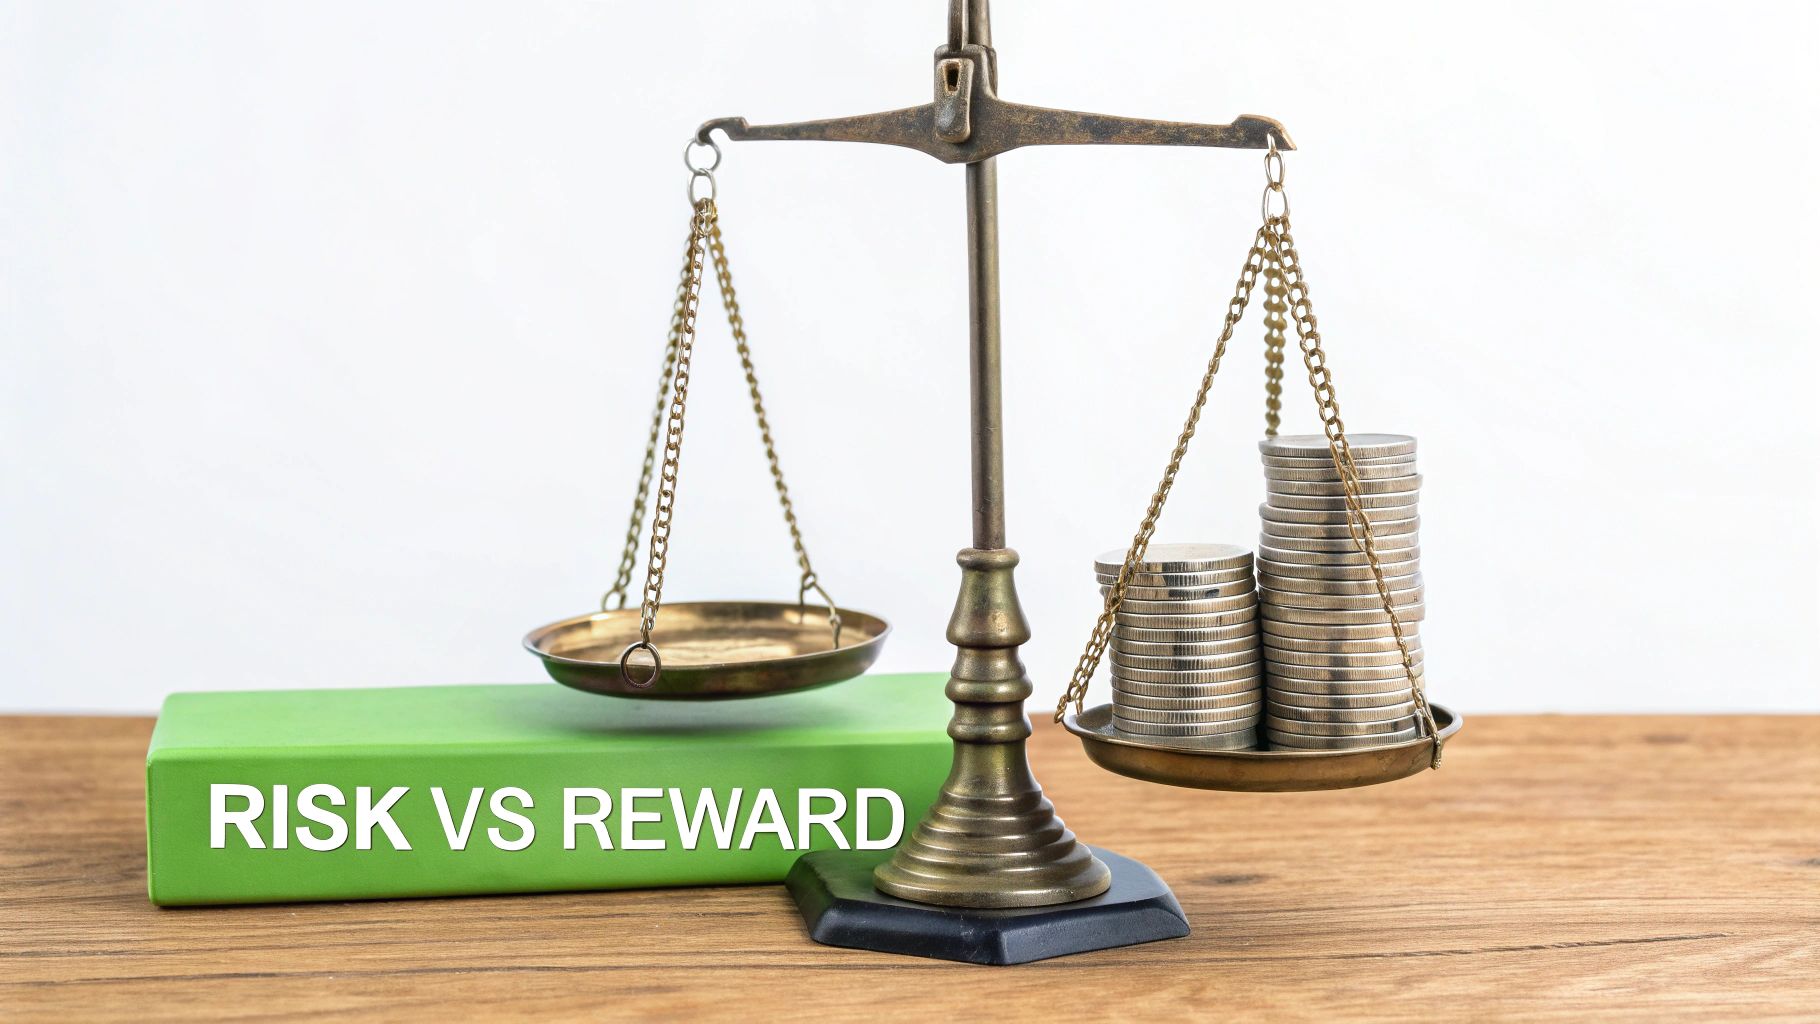
Understanding the Risk-Reward Tradeoff
Every single trade is a balance. It's a constant negotiation between its potential for profit and its exposure to loss. A high POP often means you're accepting a tiny reward in exchange for taking on a disproportionately huge, albeit unlikely, risk. This is the fundamental tradeoff you have to evaluate every single time.
To avoid the steamroller, your analysis can't stop at POP. You have to ask a critical follow-up question: "Does the potential reward justify the risk I'm taking on?" If a trade offers a 95% chance to make $50 but exposes you to a potential $2,500 loss, is that a bet you’re truly comfortable making?
The goal of a smart trader isn't just to win often; it's to make sure the wins are meaningful enough to outweigh the losses over the long haul. A high POP is attractive, but a healthy risk-reward ratio is what keeps you in the game.
Effective risk management is everything. Interestingly, concepts from other fields, like managing technical debt in risk control, offer valuable parallels. It's all about seeing the complete picture, not just the most appealing number.
Building a Framework for Risk Assessment
To protect your capital, you need a disciplined framework that goes beyond simply chasing high POP figures. This means setting firm, non-negotiable rules for your trading plan before you ever enter a position. These rules act as guardrails, preventing you from making emotional decisions based on a tempting POP.
Here are a few practical rules you might consider building into your strategy:
- Set a Maximum Loss Limit: Never enter a trade where the max potential loss is more than a set multiple of your potential gain. For instance, you might decide to avoid any trade where the risk is more than five times the reward, regardless of its POP.
- Analyze the Breakeven Point: Know exactly how far the underlying stock has to move against you before your position starts losing money. A wider breakeven gives you a bigger margin for error.
- Evaluate the Underlying Asset: Is this a stable blue-chip stock or a highly volatile name prone to wild swings? A high POP on a solid company is a world away from a high POP on a speculative meme stock.
By building these checks and balances into your process, you shift your focus from just finding probable trades to building a portfolio of well-managed risks. The probability of profit options metric is your guide for spotting opportunities, but your risk management framework is the shield that protects your capital and ensures your long-term survival in the market.
Common Pitfalls of Relying Solely on POP
While the probability of profit is a fantastic starting point for any options trade, treating it like an infallible crystal ball is a fast track to disappointment. To build a resilient strategy, you have to know a tool's limitations. Relying only on POP can lure you into common traps that can sink an otherwise solid plan.
The biggest issue is what I call the "snapshot" problem. Your POP is calculated at a single moment, capturing market conditions like a photograph. But the market isn't static—it's a living, breathing thing. A sudden spike in volatility or a sharp move in the stock can instantly change your probabilities.
A trade with a 75% POP today might drop to 50% tomorrow if the market gets spooked. This isn't a "set it and forget it" number.
Ignoring the Magnitude of Risk
This is probably the most dangerous trap of all: ignoring the relationship between your probability of winning and the size of your potential loss. A sky-high POP often comes with a dangerously skewed risk-reward profile.
Imagine a trade with a 95% probability of profit. Sounds incredible, right? But what if that trade nets you just $20 while exposing you to a potential $3,000 loss? That's the classic "picking up pennies in front of a steamroller" scenario. You can win dozens of times in a row, but that one catastrophic loss can wipe out all your gains and then some.
A high probability of profit tells you nothing about the consequences of being wrong. Smart trading isn't just about being right often; it's about making sure your wins are meaningful and your losses are manageable.
Market data backs this up. According to the CBOE, only about 10% of options contracts are ever exercised, and a whopping 30% expire worthless. That might sound like a seller's paradise, but many of those worthless expirations are part of complex hedging strategies, not simple speculative trades. You can explore more research on options profitability to see the bigger picture.
The Black Swan Problem
POP is also built on statistical models that assume a certain level of normalcy. These models are great at predicting outcomes within a typical range of price moves. What they're completely blind to are the unpredictable, outlier events—the "black swans."
These are the sudden market crashes, the surprise geopolitical events, or the shocking company news that no forecast can see coming. Your 99% POP trade offers zero protection when a true black swan hits. This is exactly why a solid risk management plan, with proper position sizing and stop-losses, is non-negotiable.
Another subtle mistake is confusing POP with the probability of an option expiring worthless. They're related, but not the same. As we've covered, POP is influenced by Delta, which also gives a rough estimate of an option finishing in-the-money. To get a better handle on this, check out our guide on what is Delta in options trading.
Ultimately, the probability of profit is a powerful guide, not a guarantee. It helps you filter for statistically favorable trades, but it must be used alongside a complete analysis of the risk-reward ratio, the underlying stock's health, and your own unbreakable risk management rules. Avoiding the rookie mistake of trusting one metric above all else is what separates beginners from traders who stick around for the long haul.
Building Your POP-Informed Trading Plan
Knowing what the probability of profit is on paper is one thing. Actually weaving it into your daily trading plan? That’s where the magic happens. A solid trading plan isn’t about just chasing the highest POP numbers you can find. It's a disciplined process that starts with your goals and uses POP as a guide, not as the final word.
The first step has nothing to do with an options chain. It starts with you. What are you trying to accomplish? Are you looking for steady weekly income, or are you swinging for the fences with bigger, directional bets? Your answer will tell you what kind of POP range you should even be looking for.
A trader without a plan is just reacting to market noise. By defining your rules first, you ensure POP serves your strategy, preventing you from chasing trades that don't align with your goals.
A Step-by-Step Framework for POP Integration
Once you know your own strategy, you can build a repeatable process for finding and placing trades. This simple framework turns POP from an abstract number into a real, actionable part of your routine. It’s a logical flow that makes sure every trade you place is deliberate.
Here’s a simple, three-step process to get started:
- Screening with POP: Use POP as your first filter. Let's say your goal is to generate income with covered calls. You might set a simple rule: only look at options with a POP greater than 75%. Right away, you’ve cut through the noise and narrowed your focus to a handful of trades that fit your baseline criteria. It saves a ton of time.
- Analyzing Risk and Reward: Now that you have a short list of high-probability trades, the real work begins. For each one, you have to ask the most important question: "Is the premium I'm collecting worth the risk I'm taking?" A trade with an 80% POP might look great, but if it only pays a few bucks while exposing you to a huge potential loss, it’s a bad trade. Toss out anything with a lopsided risk-reward profile, no matter how high the POP.
- Making the Final Decision: The last step is to bring in your own market view. What do you actually think this stock is going to do? A high-POP trade on a stock you believe is about to tank is a major red flag. Your final call should bring everything together: the stats, the risk-reward, and your gut feeling on the market.
This structured approach turns trading from a gamble into a process. You’re consistently putting the odds in your favor while keeping a close eye on your risk. By building the probability of profit into a clear plan, you stop just knowing the numbers and start confidently using them to get better results.
A Few Common Questions About POP
Once you start digging into the Probability of Profit, a few questions always come up. Let's walk through the most common ones to clear up any confusion and help you put POP to work.
Is a High POP a Guarantee of Success?
Not at all. Think of POP as a sophisticated weather forecast, not a crystal ball. A 90% chance of sun is great, but it doesn't mean a surprise shower is impossible.
A high POP gives you a statistical edge based on current market data—implied volatility, time to expiration, and the distance of your strike price. But markets are famously unpredictable. A sudden news event or a shift in market sentiment can change everything in an instant. POP is a powerful guide, not a guarantee.
How Does Implied Volatility Affect POP?
Implied volatility (IV) is a huge piece of the POP puzzle. In simple terms, higher IV means the market expects bigger price swings in the underlying stock. This directly impacts your probability of profit.
How? It depends on which side of the trade you're on:
- For options sellers: Higher IV is often your friend. It inflates the premium you collect, which pushes your breakeven points further out. A wider breakeven range means there's a larger area where your trade can be profitable, boosting your POP.
- For options buyers: The opposite is true. Higher IV makes options more expensive. That means the stock has to make a much bigger move just for you to break even, which typically lowers your probability of profit.
You can picture IV as expanding the bell curve of potential stock prices. For a seller, this creates a wider, more forgiving profit zone, and that’s what drives the POP calculation higher.
What’s Considered a "Good" POP?
This is the million-dollar question, and the answer is: it depends entirely on you. There's no magic number that works for everyone. Your ideal POP is a direct reflection of your personal risk tolerance and what you're trying to achieve.
An income-focused investor selling covered calls might feel comfortable only taking trades with an 80% POP or higher, prioritizing safety and consistency. On the other hand, someone making a speculative, directional bet might gladly accept a 40% POP if the potential reward is massive.
The key is to find a POP level that aligns with your strategy and lets you sleep at night.
Ready to stop guessing and start trading with a statistical edge? Strike Price provides real-time probability metrics and smart alerts to help you find the best covered call and secured put opportunities. Turn data into income. Get started with Strike Price today.