What Is an Option Spread? Simple Explanation & Tips
If a stock moves past your strike, the option can be assigned — meaning you'll have to sell (in a call) or buy (in a put). Knowing the assignment probability ahead of time is key to managing risk.
Posted by
Related reading
A Step-by-Step Covered Calls Example for Consistent Income
Unlock consistent income with our step-by-step covered calls example. This guide breaks down the strategy, risks, and outcomes to help you trade confidently.
Long Call and Short Put The Ultimate Synthetic Stock Guide
Unlock the power of the long call and short put strategy. This guide explains how synthetic long stock works, its benefits, risks, and how to execute it.
What is a Call Spread? A Clear Guide to Bull and Bear Spreads
What is a call spread? Discover how bull and bear spreads limit risk and sharpen your options trading strategy.
If you've ever bought a call or a put and felt that pit in your stomach as its value swung wildly, you already get why spreads exist. Trading a single option is like writing an insurance policy with unlimited liability—sure, the potential profit is huge, but so is the risk of a catastrophic loss.
An option spread, on the other hand, is like buying a well-defined insurance plan for your trade. It’s a strategy where you simultaneously buy one option and sell another option on the same underlying stock.
This simple combination completely changes the game. It creates a structure with defined risk and reward, limiting your potential losses while also, yes, capping your potential gains.
Why Trade Spreads Instead of Single Options?

By combining an option you buy (a long option) with one you sell (a short option), you’re essentially creating a financial safety net for yourself. This fundamentally alters the trading dynamic.
Capping Your Risk and Reward
The real magic of a spread is in its boundaries. The distance between the strike prices of the two options creates a hard ceiling on your maximum profit and a solid floor for your maximum loss. You know the exact dollar amount you can make or lose before you even click "buy."
This predictability is a massive advantage for traders who value risk management over chasing lottery-ticket returns. It shifts trading from a pure directional bet into a strategic position with known outcomes.
The Power of Spreads
Instead of just guessing which way a stock will go, spreads let you build trades around more nuanced market views. This strategic approach comes with some pretty significant benefits:
- Reduced Capital Requirement: Because the option you sell helps pay for the option you buy, spreads often require way less cash to open than buying a single option outright.
- Defined Risk Profile: You can enter a position knowing your max loss is capped, no matter how crazy the market gets. That’s peace of mind.
- Increased Probability of Profit: Many spread strategies are designed to make money even if the stock goes sideways or only moves slightly in your favor, which can boost your win rate.
Of course, no strategy is a free lunch. It's important to remember that options trading is inherently risky. A study by the London Business School found that from 2019 to 2021, many retail traders lost significant money, which just goes to show how critical a solid strategy and risk management are. You can dig into more options trading statistics to really understand the landscape.
Breaking Down the Anatomy of a Spread

Every option spread, no matter what you call it, is built from the same basic parts. Think of it like building with LEGOs—the individual bricks are simple, but the way you snap them together creates something powerful and unique. Getting a handle on these building blocks is the first step to mastering any spread strategy.
At its core, a spread is just buying one option while selling another on the same stock, all in a single trade. This creates two sides, or “legs,” to your position.
- The Long Leg: This is the option you buy. You pay a premium for it, and it gives you a right (to buy or sell the stock).
- The Short Leg: This is the option you sell (or "write"). You collect a premium for taking on an obligation.
The magic happens in the relationship between the premium you pay for that long leg and the premium you collect from the short one. It determines whether you start the trade with a net cost (debit) or a net income (credit). This single transaction locks in your maximum risk and reward right from the start.
The Four Core Elements
To really get what a spread is, you need to look at the four elements that give it its shape. The specific mix of these elements is what gives a spread its name, its purpose, and its profit potential.
- Underlying Asset: This is simply the stock, ETF, or index your options are tied to. Every leg in your spread will share the same underlying.
- Option Type (Call or Put): You can build a spread using all calls or all puts. Which one you choose depends on your outlook—bullish (calls) or bearish (puts).
- Strike Price: This is the price where the stock can be bought or sold. Spreads always have at least two different strike prices, and the gap between them is what defines your max profit and loss.
- Expiration Date: This is the day the options cease to exist. How much time is left on the clock directly impacts the price of the options and the kind of strategy you might use.
A spread’s entire character is defined by the relationship between its legs. Are the strike prices close together or far apart? Do they expire in the same month or different ones? Answering these questions reveals the strategy's purpose.
By tweaking these four variables, you can build dozens of different strategies. For instance, a bull call spread involves buying a call with a lower strike price and selling a call with a higher strike price—both expiring on the same day. It's a simple structure built to profit from a modest rise in the stock's price while putting a hard cap on your potential loss if you're wrong.
Decoding the Different Types of Spreads
Now that we have the building blocks down, let's start putting them together. Think of the options spread universe as having two major families, defined entirely by how money moves when you open the trade: Credit Spreads and Debit Spreads.
This is the first and most important distinction you'll make. Every single spread strategy belongs to one of these two camps, and the name itself tells you exactly what happens to your brokerage account the moment you place the trade.
This image breaks down how the relationship between the option you buy and the one you sell determines whether you pay or get paid.
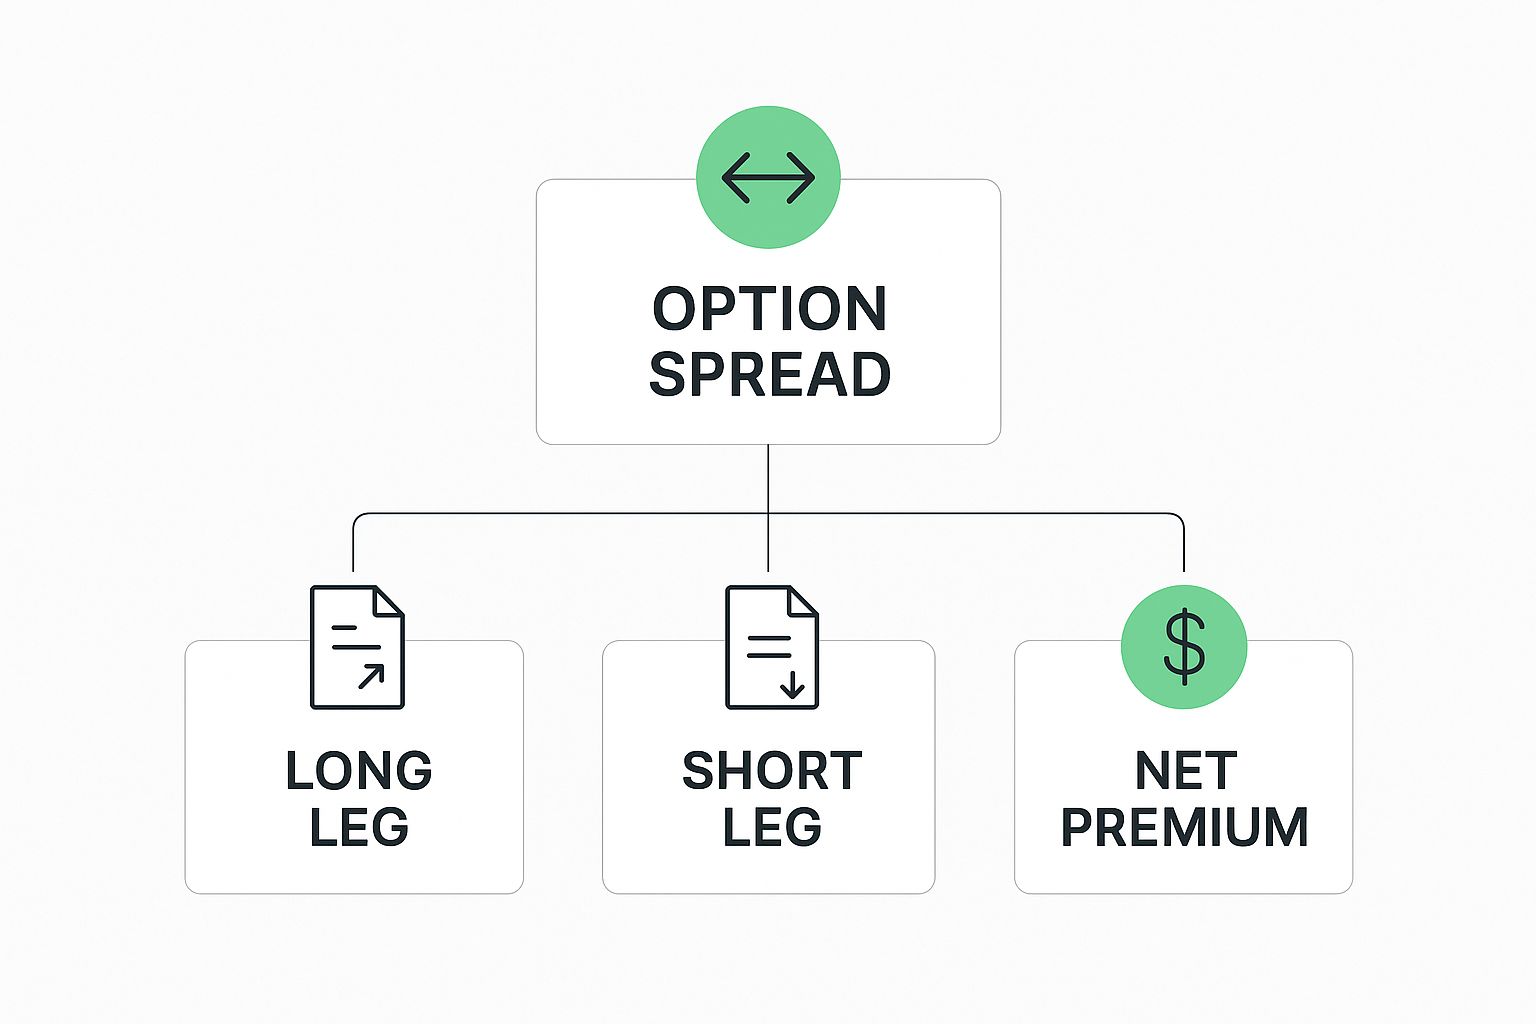
As you can see, it all comes down to which leg has the bigger premium. That simple math—the net premium—defines the entire risk profile of your trade.
Credit Spreads: The Insurance Sellers
A credit spread is any strategy where you collect cash upfront. This happens because the premium on the option you sell (your short leg) is higher than the premium on the option you buy (your long leg).
It’s a lot like being an insurance company. You collect a small, upfront premium from a client in exchange for taking on a very specific, calculated risk. Your goal is for the "disaster"—in this case, the stock moving sharply against you—not to happen. If it doesn't, you pocket the entire premium.
With a credit spread, your maximum profit is locked in from day one: it’s the net credit you receive. These are income-generating strategies, and you win if the stock simply behaves as you expect, often by staying above or below a certain price. Many traders love them for their high probability of success. To see how this plays out in the real world, check out some of the top bull put credit spread strategies for 2025 and see the concept in action.
Debit Spreads: The Lottery Ticket Buyers
A debit spread, as you probably guessed, is the opposite. It’s a strategy that costs you money to get into. Here, the option you buy has a higher premium than the option you sell, creating a net debit from your account.
Think of this like buying a lottery ticket that has a fixed, known price. You're paying a relatively small amount for a chance at a much larger payout if you're right. The best part? Your maximum loss is strictly limited to the initial cost of the "ticket."
Debit spreads are directional bets. You need the underlying stock to make a move in your favor to turn a profit. And unlike their credit spread cousins, time is your enemy here, as the value of your position can decay the closer you get to expiration.
To help you keep these two core concepts straight, here’s a quick side-by-side comparison.
Credit Spreads vs Debit Spreads: A Quick Comparison
This table highlights the fundamental differences between the two main families of option spreads.
| Characteristic | Credit Spread | Debit Spread |
|---|---|---|
| Initial Cash Flow | You receive a net credit (cash in). | You pay a net debit (cash out). |
| Primary Goal | Generate income. | Profit from a directional move. |
| Max Profit | Capped at the initial net credit received. | Capped, but potentially much larger than the initial cost. |
| Max Loss | Capped, but larger than the credit received. | Capped at the initial net debit paid. |
| Time Decay (Theta) | Works in your favor (helps your position). | Works against you (hurts your position). |
| Analogy | Acting as an insurance seller. | Acting as a lottery ticket buyer. |
Understanding this table is key. Knowing whether you want to collect premium or pay for a directional move is the first step in choosing the right spread for your market outlook.
Vertical, Horizontal, and Diagonal Spreads
Beyond the credit/debit divide, spreads also get their names from how their strike prices and expiration dates are laid out. The names sound a little technical, but they're just a simple way to describe the trade's structure.
Vertical Spreads: These are the bread-and-butter of the spread world. The options have the same expiration date but different strike prices. They're called "vertical" because on a standard options chain, the different strikes are listed vertically under the same expiration column. A bull call spread is a perfect example.
Horizontal Spreads (Calendar Spreads): With these, the options share the same strike price but have different expiration dates. You might sell a near-term option and buy a longer-term one. These are fantastic strategies for profiting from the passage of time (theta decay).
Diagonal Spreads: You guessed it—this is the hybrid. The options have both different strike prices and different expiration dates. This setup combines elements from both vertical and horizontal spreads, creating more complex and nuanced risk/reward profiles for advanced traders.
How to Visualize Your Profit and Loss

Trading strategies can feel abstract until you can actually see what’s happening. For an option spread, the best way to do that is with a payoff diagram. Think of it as the visual language of options trading—a simple chart that instantly translates a complex strategy into a clear picture of risk and reward.
A payoff diagram maps out your potential profit or loss at expiration against every possible price of the underlying stock. Once you get the hang of reading one, you can glance at any spread and immediately understand its financial profile without having to crunch any numbers.
The chart is built on two simple axes:
- The Horizontal Axis (X-axis): This tracks the price of the underlying stock at expiration.
- The Vertical Axis (Y-axis): This shows your profit or loss on the trade.
The "zero" line on that vertical axis is your breakeven point. Anything above it is profit; anything below is a loss. Simple as that.
Building a Diagram for a Bull Call Spread
Let's walk through a classic example: a bull call spread. If you recall, this strategy involves buying a call at a lower strike price while simultaneously selling another call at a higher strike.
On their own, the long call has unlimited profit potential, and the short call has unlimited loss potential. But when you combine them, their profit and loss profiles merge into a new, totally different shape. The payoff diagram for a bull call spread has a distinct "Z-shape," which is the visual proof that you have both a capped profit and a capped loss.
The most important spots on any spread's payoff diagram are the "knees," or the sharp bends in the line. These bends always happen right at the strike prices of the options you used to build the spread.
These bends are the inflection points where the trade's financial dynamics shift. For our bull call spread, here’s what’s happening:
- Below the first strike: The position sits at its maximum loss because both calls expire worthless.
- Between the two strikes: The position starts climbing into profit territory as your long call gains value.
- Above the second strike: The position hits its maximum profit and flatlines. Here, the gains from your long call are perfectly canceled out by the losses from your short call.
This visual tells you everything. It confirms that no matter how high the stock skyrockets, your profit is capped. And no matter how far it tumbles, your loss is strictly limited to the net debit you paid to open the trade. The diagram makes the defined-risk nature of spreads crystal clear.
Of course, this chart just shows you the outcome based on price at expiration. Other forces are always at play. To get the full picture on how things like time decay and volatility can affect your position along the way, you’ll want to learn more about the option greeks in our detailed guide.
Spreads in Action: Two Real-World Examples
Payoff diagrams are great for visualizing the theory, but nothing clicks until you see a spread trade with real numbers. Let's walk through how a trader would set up a couple of common spreads, one bullish and one bearish, to see how the concepts translate into actual dollars and cents.
This is where we move from knowing what a spread is to understanding how to actually use one.
Example 1: The Bull Put Spread (A Credit Strategy)
Let's say you're feeling pretty good about Company XYZ. It's trading at $105 a share, and while you don't see it launching to the moon, you're confident it will stay above $100 for the next month. This is a classic setup for a bull put spread.
Instead of buying stock, you can construct a trade to get paid for your mildly bullish opinion. You'll sell a put option to collect some cash, and buy a cheaper one further down to act as your safety net.
- Your Action: Sell the $100 put option, collecting a $2.00 premium.
- Your Protection: At the same time, buy the $95 put option, paying a $0.50 premium.
By combining these two moves, you’ve instantly put cash in your account.
Net Credit Received: $2.00 (from the put you sold) - $0.50 (for the put you bought) = $1.50 per share ($150 per contract)
That $150 is yours to keep, and it's also your maximum possible profit. All you need is for XYZ to close above $100 on expiration day.
- Maximum Profit: Your max gain is locked in at the $150 net credit you took in upfront.
- Maximum Loss: This is the difference between the strikes ($5) minus the credit you received ($1.50). So, $5.00 - $1.50 = $3.50 per share ($350 per contract).
- Breakeven Price: The trade only starts losing money if XYZ drops below your short strike minus your credit. That's $100 - $1.50 = $98.50.
Example 2: The Bear Call Spread (A Credit Strategy)
Now, let's flip it. You’re looking at Company ABC, trading at $52, and you think it’s run out of steam. You don’t necessarily expect a crash, but you think it's very unlikely to rally past $55 anytime soon. This is the perfect scenario for a bear call spread.
This time, you'll use call options to build a trade that makes money if the stock chops around or drifts lower.
- Your Action: Sell the $55 call option, collecting a $1.00 premium.
- Your Protection: Simultaneously, buy the $60 call option, paying $0.25 for it.
Just like the bull put, this trade generates an immediate credit because the option you sold was worth more than the one you bought. The sheer number of these trades happening every day is staggering; in fact, the put/call ratio is a widely watched market sentiment gauge. You can find more data on option trading volume at OptionMetrics.
Net Credit Received: $1.00 (from the call you sold) - $0.25 (for the call you bought) = $0.75 per share ($75 per contract)
That $75 is your max profit on the trade.
- Maximum Profit: The $75 net credit you pocketed. You keep it all as long as ABC closes below $55 at expiration.
- Maximum Loss: The width of the spread ($5) minus the credit you received ($0.75). That works out to $4.25 per share ($425 per contract).
- Breakeven Price: Your short strike plus the credit you collected. The trade becomes a loser only if ABC rallies past $55 + $0.75 = $55.75.
Why Market Volatility Is Your Secret Weapon
To really succeed with spreads, you have to look past simple price direction—you have to master volatility. Sure, knowing where a stock might go is important. But understanding the level of fear or complacency baked into the market? That can be even more powerful.
This brings us to implied volatility (IV), which is the real engine that drives option prices.
Think of implied volatility as the market's best guess on how much a stock will swing around in the future. High IV is like a storm warning; the market expects big moves, so options get more expensive. When IV is low, the seas are calm, and option premiums get cheap.
This constantebb and flow creates two very different opportunities for spread traders.
High Volatility: A Seller's Market
When implied volatility spikes, option premiums get seriously inflated. For credit spread sellers, this is a playground. Why? Because you're selling options when they're priced at their absolute richest, letting you collect a fat premium right out of the gate.
Your goal is for that bloated premium to shrink as the anticipated "storm" never quite hits, or as the market's uncertainty starts to fade. You're essentially betting against the market's fear and getting paid to believe things will be less chaotic than everyone thinks. It's no wonder so many traders hunt for high IV environments to sell their credit spreads.
Implied volatility is the 'fear gauge' of the options market. High IV means high fear and expensive options. Low IV signals complacency and cheaper options. Your strategy should adapt to whichever environment you are in.
Low Volatility: A Buyer's Opportunity
On the flip side, when implied volatility is low, options are on sale. This is often the perfect time to be a debit spread buyer. You get to purchase your spread when the components are cheap, setting yourself up to profit from a potential pop in both the stock's price and its volatility.
If the stock makes the move you predicted and volatility starts to climb, the value of your spread can jump dramatically. You’re essentially buying your lottery ticket when the price is at its lowest, maximizing your potential return. If you want to dive deeper into this key metric, you can learn more about how to calculate implied volatility in our complete guide.
Ultimately, keeping an eye on volatility is critical to the success of any spread. Investors in the U.S. often use the VIX to gauge market sentiment. On major international exchanges like Eurex, traders watch the VSTOXX index—which tracks volatility in the Euro Stoxx 50—to fine-tune their strategies.
Common Questions About Option Spreads
Once you start moving from theory to practice, a few common questions always seem to pop up. Let's walk through some of the most frequent ones traders ask when they first get into spreads.
Can I Lose More Than the Maximum Loss?
For defined-risk trades like vertical spreads, this is a core benefit: your maximum loss is locked in the moment you open the position.
While super rare events like early assignment or odd fees could technically shift the final numbers, the theoretical max loss from the options themselves is capped. That's the whole point.
When Should I Close a Spread?
Most experienced traders don't hold their spreads all the way to expiration day. The goal is to lock in a solid profit and get out before the end-of-week craziness starts.
A popular rule of thumb for credit spreads is to close the trade once you've captured 50-75% of the maximum possible profit. This gets you out of the trade early, sidestepping the volatility and assignment risks that can spike right before the contracts expire.
While we're talking about spreads, it’s worth noting that other financial products use similar language. For instance, you might come across understanding financial spread betting, which is a totally different way to speculate on the markets.
Key Takeaway: Early assignment is always a possibility, especially for the short leg of your spread. If you get assigned, you'll end up with a stock position, but don't panic—you can typically manage it by exercising your long leg to cancel it out.
Ready to turn options theory into consistent income? Strike Price provides real-time probability data to help you sell covered calls and secured puts with confidence. Stop guessing and start making data-driven decisions. Discover your next trade at https://strikeprice.app.