How to Backtest a Trading Strategy the Right Way
If a stock moves past your strike, the option can be assigned — meaning you'll have to sell (in a call) or buy (in a put). Knowing the assignment probability ahead of time is key to managing risk.
Posted by
Related reading
A Step-by-Step Covered Calls Example for Consistent Income
Unlock consistent income with our step-by-step covered calls example. This guide breaks down the strategy, risks, and outcomes to help you trade confidently.
Long Call and Short Put The Ultimate Synthetic Stock Guide
Unlock the power of the long call and short put strategy. This guide explains how synthetic long stock works, its benefits, risks, and how to execute it.
What is a Call Spread? A Clear Guide to Bull and Bear Spreads
What is a call spread? Discover how bull and bear spreads limit risk and sharpen your options trading strategy.
Before you even think about putting a single dollar on the line with a new trading idea, you have to see if it even has a chance of working. That’s what backtesting is all about. It’s a simple concept: you define your exact trading rules, get your hands on some high-quality historical market data, and then run your strategy against that past data to see how it would have performed.
It’s your chance to see how your idea would’ve held up, all without any real financial risk.
Why Backtesting Is Your Most Important Trading Habit

Think of backtesting as a flight simulator for your trading strategies. It gives you the power to fly through years of market chaos—crashes, rallies, and everything in between—all from the safety of your desk. This is how you move from relying on gut feelings to making decisions backed by cold, hard data.
A proper backtest transforms a vague idea into a system with predictable behaviors, giving you the confidence and statistical edge you need before you ever place a live trade.
Gaining a Statistical Edge
Backtesting is your personal trading lab. It's a risk-free sandbox where you can experiment with all the different knobs and levers of your strategy—your entry signals, exit rules, stop-loss placements, you name it. By running these simulations, you can quantify your strategy's potential and, just as importantly, uncover its fatal flaws.
This process is a crucial 'practice run' that reveals key statistics like your expected return, profit factor, and maximum drawdown. For instance, you might find a strategy with a win rate below 50% is still incredibly profitable because it has a fantastic risk-reward ratio. As a general rule of thumb, many traders look for a Sharpe ratio above 1.0 and a maximum drawdown below 20% as a starting point for a viable strategy. You can dig deeper into using historical data effectively on After Pullback’s blog.
To perform a truly meaningful backtest, you need a few core components in place. Each one is critical for ensuring your results are reliable and not just a product of wishful thinking.
The table below breaks down these essential pillars.
Key Pillars of a Successful Backtest
| Component | Why It's Critical | Example |
|---|---|---|
| Clear Trading Rules | Ambiguity leads to flawed results. Your rules for entry, exit, and position sizing must be 100% objective and mechanical. | "Enter a long position when the 50-day moving average crosses above the 200-day, and exit when it crosses back below." |
| High-Quality Data | "Garbage in, garbage out." Your data must be clean, accurate, and cover various market conditions (bull, bear, sideways). | Using tick-level data for a high-frequency strategy, or daily data adjusted for splits and dividends for a long-term one. |
| Robust Testing Engine | You need software or a custom script that can accurately simulate trades, account for commissions, and avoid look-ahead bias. | Platforms like TradingView, TradeStation, or custom Python scripts using libraries like backtrader. |
| Honest Analysis | Don't just look for good results. You need to analyze the bad, too—drawdowns, losing streaks, and performance in different environments. | Calculating your maximum drawdown, average losing trade, and comparing performance in volatile vs. calm periods. |
Getting these four pillars right is non-negotiable. If you skimp on any one of them, you might as well be guessing, and your backtest results won't be worth the screen they're displayed on.
Understanding Your Strategy's Personality
Every trading strategy has a unique personality. Some are grinders, steadily churning out small, consistent wins. Others are home-run hitters, experiencing gut-wrenching drawdowns before landing a massive winner.
A backtest is how you uncover this character by answering the tough questions:
- How often does this thing actually win?
- What's the average winning trade versus the average loser?
- How long are the losing streaks I'll have to sit through?
- Does it work better when the market is trending or just chopping sideways?
A thorough backtest doesn't just tell you if a strategy could have made money. It prepares you psychologically for the inevitable pain of executing it in the real world.
When you know these details, you’re far more likely to stick with your plan during a drawdown, because you’ve already seen your strategy survive similar—or even worse—conditions in the past.
While a fantastic backtest never guarantees future profits, it's the closest thing we have to a crystal ball. It’s the professional’s way of vetting an idea before putting real capital to work.
Getting Your Hands on High-Quality Trading Data

Let's be blunt: your backtest is only as good as the data you feed it. This is the absolute foundation of your entire analysis. The old saying, "garbage in, garbage out," has never been more true in trading.
A flawed dataset will give you flawed results. It might give you a dangerously false sense of confidence in a bad strategy or, just as bad, cause you to throw away a real winner. Getting this first step right is non-negotiable if you want to seriously learn how to backtest a trading strategy.
Sourcing Your Historical Data
Your first big decision is where to get the raw material. You have two main paths: free sources and paid providers. Each has trade-offs, and the right choice depends on your strategy's needs and your budget.
Free Data Sources: The appeal here is obvious—they're free. For high-level, long-term strategy ideas, sources like Yahoo Finance can be a decent starting point. The problem? Free data is often a minefield of errors, missing periods, and a lack of adjustments for critical corporate actions like stock splits and dividends.
Paid Data Providers: This is where serious traders live. Professional vendors supply clean, reliable, and comprehensive data. They've already done the hard work of adjusting for splits and dividends, saving you a massive headache. Sure, it costs money, but the time saved and the confidence gained are almost always worth it.
Matching Data Granularity to Your Strategy
Not all data is created equal. The "granularity"—or the time frame of each data point—you need depends entirely on your trading style. A day trader and a long-term investor live in different data universes.
Tick Data: The most detailed data you can get, recording every single trade. This is essential for high-frequency traders and scalpers whose edge is measured in seconds.
Minute Data (1M, 5M, 15M): This is the sweet spot for most intraday strategies, like day trading or short-term swing trading. It offers a great balance of detail without overwhelming your computer.
Daily Data (D1): Perfect for position traders and investors. If your holding periods are weeks or months, the daily open, high, low, and close prices are all you need.
Using daily data for a 5-minute scalping system will completely invalidate your test. The reverse is also true—using tick data for a long-term investment strategy is just computational overkill.
The Crucial Art of Data Cleaning
Even if you pay for data, you need to understand what makes it "clean." This process ensures your historical data accurately reflects what a trader would have actually seen.
Survivorship bias is one of the most dangerous and subtle traps in backtesting. It happens when you only test on stocks that exist today, ignoring all the companies that went bankrupt, were acquired, or got delisted.
This creates a deceptively positive picture because your test only includes the winners. A realistic dataset must include these delisted stocks to give you a true sense of risk. To be effective, your backtest should span at least 5 to 10 years to cover various market cycles. You can discover more about why historical data quality is paramount from Quantified Strategies.
Your data hygiene checklist must also account for:
- Missing Data: Gaps in your data can throw off indicator calculations. You need a consistent rule for handling them, like filling the gap with the last known price.
- Splits and Dividends: When a stock splits 2-for-1, its price is cut in half, but its value isn't. Your data has to be "split-adjusted" so your backtest doesn't see this as a 50% crash. Dividends must also be factored in, as they are a key part of total return.
This is the unglamorous but essential work that makes your results trustworthy. Get the data right, and you've built a solid foundation for everything that follows.
Choosing Your Backtesting Platform and Approach
With clean data in your hands, the next big decision is picking your backtesting battleground. The right path really depends on your tech skills, your budget, and how complex your trading strategy is. There's no single "best" way to do this—only the best way for you.
Your options range from a simple spreadsheet to a full-blown, code-driven engine. Choosing correctly is a huge part of learning how to backtest a trading strategy effectively. The tool you pick will dictate the speed, depth, and ultimately, the accuracy of your results.
Manual vs. Automated Backtesting
The first fork in the road is deciding whether to do the work by hand or let a computer handle the heavy lifting. Both approaches have their merits.
Manual Backtesting: This is the old-school way, usually involving a spreadsheet (like Excel or Google Sheets) and your favorite charting platform. You literally scroll back in time on your charts, spot trade setups based on your rules, and log every single result. It's slow and can be tedious, but it forces you to internalize every nuance of your strategy.
Automated Backtesting: This is the modern standard for any serious trader. You use specialized software or a bit of programming to automatically run your strategy against years of historical data. It’s incredibly fast—what takes you days to do manually can be done in minutes.
My Advice: Even if you plan to go the automated route, do a small manual backtest first. The hands-on process of logging just 20-30 trades will give you an intuitive feel for your strategy's rhythm and behavior that no automated report can ever truly capture.
Selecting Your Backtesting Software
When it comes to automation, the tools generally fall into two camps: platforms that don't require coding and frameworks that do.
1. No-Code Visual Platforms Think of platforms like TradingView or TrendSpider. They have user-friendly interfaces where you can build strategies using dropdown menus and visual tools—no coding required. They're fantastic for beginners or for quickly testing simpler, indicator-based strategies.
2. Code-Based Frameworks
This is the power-user approach. It involves using a programming language, most often Python with libraries like Backtrader or bt. This path gives you total flexibility to test highly complex, unique, or multi-asset strategies that no-code platforms just can't handle. It's powerful, but it does require some coding chops.
This simple flowchart shows the basic steps you'll take with almost any automated backtesting tool.
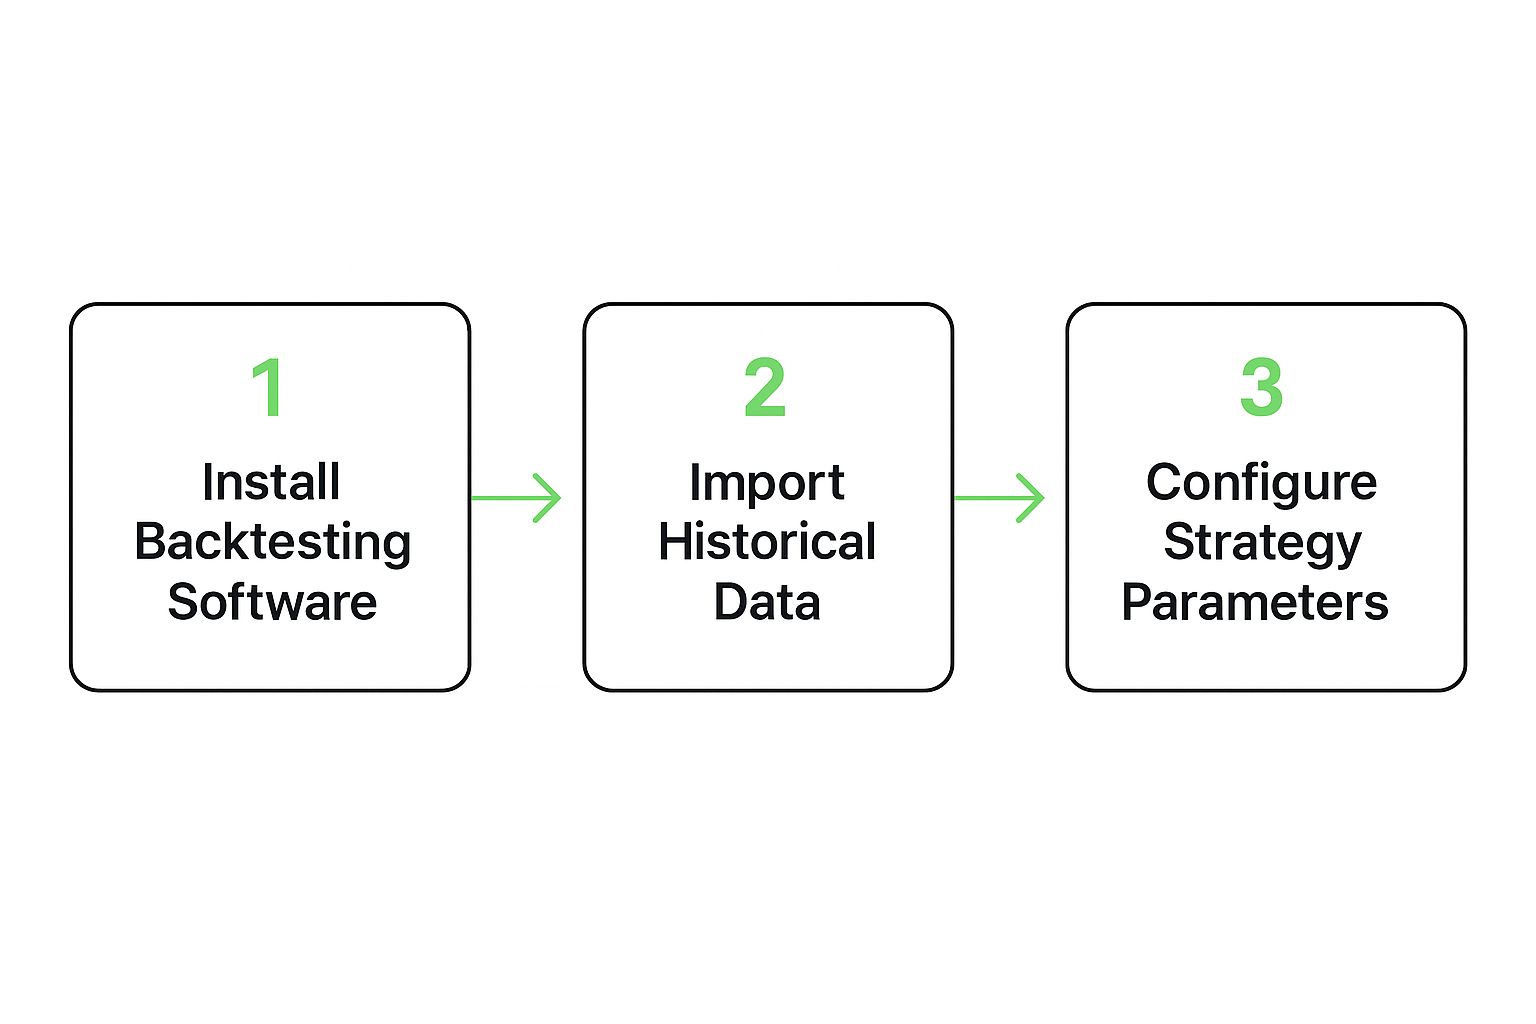
As you can see, no matter the tool, the core workflow is the same: get the software set up, load your historical data, and clearly define your strategy's rules.
Two Core Backtesting Philosophies
Beyond just the tools, you also have to pick a philosophical approach. Professional traders generally lean toward one of two methods for developing a strategy: the Hypothesis Method or Data Mining.
With the Hypothesis Method, you start with a theory about the market—for example, "a stock hitting a new 52-week high is likely to keep going up." Then you build rules to test that specific idea.
Data Mining, on the other hand, is about letting algorithms sift through massive datasets to find repeating patterns, without any preconceived bias. Both methods are critical for avoiding overfitting, which is when your strategy looks perfect on past data but falls apart in live trading.
Each approach comes with its own risks. The Hypothesis Method can be skewed by your own personal biases, while Data Mining can easily lead you to find meaningless patterns that won't hold up in the real world.
For traders focusing on options—especially income strategies like covered calls and secured puts—a solid testing process is non-negotiable. For a deeper dive, check out our detailed guide to backtest option strategies, which covers techniques specifically for those instruments.
How to Read Your Backtest Results Like a Pro
So, you’ve run your backtest and the engine spit out a report. Seeing a positive net profit is a great start, but that number alone doesn't tell you the whole story. The real work—the part that separates gamblers from data-driven traders—begins now.
This is where you dig in and get to know the personality of your strategy. Is it a slow-and-steady earner, or a high-risk system that requires an iron stomach? Let's break down how to read the numbers to find out.
Beyond Net Profit: The Core Metrics
Your backtest report is probably overflowing with data points. Don't get overwhelmed. Most of it is noise. You only need to focus on a handful of metrics that truly define a strategy's performance and risk profile.
A high win rate, for instance, feels fantastic but is often a vanity metric. What good is a 75% win rate if your average losing trade wipes out five winning trades? You'd be slowly bleeding your account dry while feeling like a genius most of the time. This is why looking at the complete picture is non-negotiable.
The goal isn't just to find a strategy that could have made money. It's to find one whose risk profile you can actually stomach when real money is on the line.
Unpacking the Key Performance Indicators
Let's get into the nitty-gritty and look at the most critical metrics you'll find in any standard backtest report. Understanding how these numbers connect is the key to learning how to backtest a trading strategy like an expert.
Profit Factor: This is your gross profit divided by your gross loss. It’s a simple, powerful metric that tells you how many dollars your strategy made for every dollar it lost. A profit factor of 1.0 is just breakeven. Anything above 1.5 is generally considered pretty solid, and if you see something over 2.0, you've got something worth a closer look.
Sharpe Ratio: This classic metric measures your risk-adjusted return. In plain English, it tells you how much bang you're getting for your buck—how much return you’re getting for the amount of volatility (risk) you're taking on. A higher Sharpe Ratio, typically above 1.0, suggests a better performance for the level of risk involved.
Maximum Drawdown: This is the big one, the metric that speaks directly to your psychological fortitude. It represents the largest peak-to-trough decline your account would have suffered during the test. This number shows you the most painful losing streak you would have had to live through. Seriously ask yourself: could you handle watching your account drop by that much without panicking and abandoning the system?
These three metrics are the trifecta of a good initial analysis. A strategy with a healthy profit factor, a good Sharpe ratio, and a drawdown you can live with is a system worth investigating further. This kind of deep dive is especially critical when you want to backtest option strategies, where the risk variables can get much more complex.
To make this crystal clear, here’s a quick breakdown of what these metrics tell you about your strategy's behavior.
Essential Backtesting Performance Metrics Explained
This table breaks down the most important metrics for evaluating a trading strategy's performance and its inherent risk.
| Metric | What It Measures | Why It's Important |
|---|---|---|
| Profit Factor | The ratio of total profits to total losses. | It quickly shows if the strategy's wins are substantial enough to cover its losses and still generate a profit. |
| Sharpe Ratio | The return of the strategy compared to its volatility. | It answers the question: "Am I being compensated for the risk I'm taking?" A higher value is better. |
| Maximum Drawdown | The largest single drop from a portfolio's peak value. | This is a crucial indicator of psychological tolerance. It shows the worst-case loss you must be prepared to stomach. |
Think of these metrics as a team. A high profit factor is great, but not if it comes with a terrifying drawdown. A low drawdown is comforting, but not if the Sharpe Ratio is abysmal, meaning you're getting tiny returns for your risk. They all have to work together.
Putting It All Together: A Real-World Example
Imagine you test two different strategies over the same 10-year period.
Strategy A: Has a 30% win rate but an impressive Profit Factor of 2.5. Its Maximum Drawdown is 15%. This is likely a trend-following system that takes many small losses but occasionally catches massive, profitable moves.
Strategy B: Boasts a 70% win rate but a mediocre Profit Factor of 1.3. Its Maximum Drawdown is 18%. This is probably a mean-reversion strategy that banks frequent small wins but can suffer from large, unexpected losses when a strong trend takes hold.
So, which one is "better"? Neither. They just have different personalities.
A trader who needs constant positive reinforcement might love Strategy B, while a trader with extreme patience and discipline could excel with Strategy A. Reading your backtest results is ultimately an exercise in self-awareness—matching a strategy’s statistical profile with your own psychological tolerance for risk, patience, and uncertainty.
Common Backtesting Traps and How to Avoid Them
A beautiful backtest report can be dangerously misleading. I’ve seen countless strategies that look incredible on paper—generating those near-perfect equity curves we all dream of—only to fall apart the moment they hit a live market. This usually happens because the testing process was riddled with hidden biases and fundamental errors.
To truly master backtesting, you have to learn to spot these traps before they cost you real money. Your goal isn't just to get a good result; it's to get an honest result. This means confronting the common pitfalls that can inflate performance and give you a false sense of security.
Overcoming Overfitting: The Strategy Killer
The single biggest trap in all of backtesting is overfitting, sometimes called curve-fitting. This is what happens when you tweak your strategy's parameters so much that it perfectly matches the historical data you're testing it on. The result is a system that has essentially memorized the past but has learned nothing about how to handle the future.
Imagine trying to create a strategy for a single stock. You might find that a 13-period moving average combined with a 2.3x ATR stop-loss produced flawless results between 2018 and 2021. But those specific numbers are likely just random noise—they worked for that unique period and that stock, and they will almost certainly fail anywhere else.
Overfitting is like creating a key that perfectly fits a single, specific lock. The moment you try to use that key on any other lock, it becomes completely useless.
To fight this, you need to validate your strategy on data it has never seen before. Two powerful techniques for this are out-of-sample testing and walk-forward analysis.
Out-of-Sample (OOS) Testing: This is the simplest method. You split your historical data into two sets. For example, if you have 10 years of data, you might use the first 7 years (2014-2020) to build and optimize your strategy. This is your "in-sample" data. Then, you test the finalized strategy on the remaining 3 years (2021-2023), the "out-of-sample" data, without making any changes. If the strategy holds up on the OOS portion, it's a good sign that it’s robust.
Walk-Forward Analysis: This is a more advanced and robust version of OOS testing. It involves a rolling process of optimization and validation. For instance, you could optimize your strategy on data from 2018, then test it on 2019. Next, you optimize on 2019 and test on 2020, and so on, "walking forward" through your dataset one period at a time. This method more closely simulates how a trader would periodically re-optimize a live strategy.
Dodging Other Subtle but Deadly Biases
While overfitting is the main villain, other subtle biases can quietly destroy your backtest's integrity. Being aware of them is half the battle.
Survivorship Bias This trap happens when you only backtest on assets that are still trading today. You inadvertently ignore all the companies that went bankrupt, were acquired, or were delisted. This skews your results positively because you're only testing on the "survivors." A truly realistic test must include data for these delisted stocks to accurately reflect real-world risk.
Look-Ahead Bias This is a more technical error where your backtesting code accidentally uses information that would not have been available at the time of the trade. A classic example is using the day's closing price to decide on an entry signal that should have happened at the market open. It’s like peeking at the answers before the test. You have to ensure your testing engine only processes data bar-by-bar, just as it would unfold in real time.
Ignoring Transaction Costs A seemingly profitable strategy can quickly become a loser once you factor in real-world costs. Every backtest must include realistic estimates for:
- Commissions: The fee your broker charges for each trade.
- Slippage: The difference between the price you expected and the price you actually got. This is especially critical for volatile markets or large order sizes.
These pitfalls highlight why a disciplined approach to testing is so vital. It’s not just about running numbers; it’s about conducting a fair and honest experiment. Managing these risks is a core component of trading, and you can learn more by exploring our detailed guide on options risk management, which covers principles applicable to all forms of trading.
From a Successful Backtest to Live Trading
You’ve done the heavy lifting. You've sourced clean data, coded your rules, sidestepped the common biases, and now you have a backtest report showing a profitable, solid strategy. So, what’s the move? That leap from historical data to risking real capital is where so many traders trip up.
This isn't a sprint. It’s a deliberate, careful rollout. Jumping headfirst from a great backtest into a full-sized live position is a classic recipe for blowing up an account. No simulation, no matter how detailed, can truly replicate the chaos and nuance of a live market.
Validate with Paper Trading
Your very first step should be to paper trade the strategy. Think of it as a critical bridge connecting your historical simulation to the real-time market. While you’re using fake money, your strategy is now battling live data feeds, broker delays, and the unpredictable flow of an open market.
Paper trading is all about answering a few key questions:
- Does the strategy actually hold up with real-time price action?
- Are there strange execution quirks or data feed issues you never saw in the backtest?
- Can you physically keep up and execute all the signals without getting flustered?
This is your final dress rehearsal. It’s where you confirm the system works in practice, not just in theory, before a single real dollar is on the line.
A backtest shows you what could have been. Paper trading shows you what is happening now. Live trading with small size shows you how you react when it matters.
Start Small and Manage Psychology
Once paper trading gives you the green light, it’s time to go live—but with a small, controlled position size. I’m talking about a risk level that’s almost emotionally meaningless. The point here isn't to get rich; it's to test your own mental game.
Putting real money on the line, even a tiny amount, introduces emotions that no backtest can ever simulate. The fear of a loss, the greed for a bigger win, and the anxiety during a drawdown can make even the most disciplined trader deviate from their plan.
Starting small lets you feel these pressures in a low-stakes game. It helps you build the discipline to execute your strategy perfectly when the stakes get higher. This phase is as much a test of you as it is of your strategy.
Backtesting Is a Continuous Cycle
Finally, remember that backtesting isn't a one-and-done project. Markets aren't static. They shift and evolve, and a strategy that prints money today could be obsolete six months from now.
You have to treat backtesting as a loop: monitor, re-validate, and refine.
Every so often, run your strategy against the most recent market data. See if its edge is still there or if it's starting to degrade. This constant validation is what separates the pros who build lasting careers from the amateurs who burn out. It's how you adapt and stay effective for the long haul.
Common Backtesting Questions Answered
When you first start backtesting, you'll find yourself running into the same handful of questions over and over. Getting straight answers is the only way to build a process you can actually trust and to know what your results are really telling you.
Let's tackle some of the most common ones I hear from traders.
How Much Historical Data Is Enough?
There isn't a single magic number here, but a solid rule of thumb is to have at least 5-10 years of quality data. The real goal isn't just the length of time, but what happened during that time.
You need to make sure your data covers a mix of market conditions:
- Bull Markets: Those long stretches of upward momentum.
- Bear Markets: The painful, prolonged downturns.
- Sideways Conditions: The choppy, frustrating periods where the market goes nowhere.
If your strategy has only been tested in a bull run, you have no idea how it will hold up when the tide turns. Seeing it perform under all these different pressures gives you a much more honest picture of its true strength.
Can a Good Backtest Guarantee Profits?
Let's be blunt: no. A profitable backtest is an incredible confidence booster and a non-negotiable part of risk management, but it is not a guarantee of future returns. Markets are always changing, and strategies can fall out of favor. What worked like a charm for the last five years might not work next month.
Think of a backtest as a statistical edge, not a crystal ball. It proves your strategy had a historical advantage, which is a world away from just trading on a gut feeling.
What Is a Good Profit Factor?
The profit factor is a great back-of-the-napkin metric to see if you're on the right track. Simply put, any value over 1.0 means your strategy made more money than it lost.
But "profitable" isn't the same as "good." Most experienced traders I know look for a profit factor of at least 1.5 as a first hurdle. Anything over 2.0 is generally considered excellent. Just remember, this number doesn't live in a vacuum—you have to weigh it against your maximum drawdown and other risk metrics to get the full story.
Stop gambling and start making data-driven decisions with your options selling. Strike Price provides real-time probability metrics to help you find the perfect balance between premium income and safety. Turn guesswork into strategy with Strike Price today.