How to Read Options Chain Data Like a Pro
If a stock moves past your strike, the option can be assigned — meaning you'll have to sell (in a call) or buy (in a put). Knowing the assignment probability ahead of time is key to managing risk.
Posted by
Related reading
A Step-by-Step Covered Calls Example for Consistent Income
Unlock consistent income with our step-by-step covered calls example. This guide breaks down the strategy, risks, and outcomes to help you trade confidently.
Long Call and Short Put The Ultimate Synthetic Stock Guide
Unlock the power of the long call and short put strategy. This guide explains how synthetic long stock works, its benefits, risks, and how to execute it.
What is a Call Spread? A Clear Guide to Bull and Bear Spreads
What is a call spread? Discover how bull and bear spreads limit risk and sharpen your options trading strategy.
When you first pull up an options chain, it can look a little intimidating. All those numbers, columns, and colors can feel like staring at the matrix. But don't worry—it's just a grid that organizes all the available option contracts for a stock, and learning to read it is the first real step toward smarter trading.
Think of it like this: Calls (your bet that a stock will go up) are usually on the left, and Puts (your bet it will go down) are on the right. It’s a clean, side-by-side comparison that gives you a full picture of the market's bets on a single stock.
Your First Look at an Options Chain
Diving into options for the first time often feels like you're learning a whole new language, and the options chain is the main textbook. At first glance, the wall of data can seem overwhelming, but it’s really just a detailed list of every available option contract for a particular stock, laid out to help you find an opportunity.
I like to think of it as a flight board at an airport. Just as the board shows you all the destinations, departure times, and flight numbers, an options chain lists all the available strike prices, expiration dates, and the cost (premium) for each contract. Your job is to find the "flight" that matches your trading destination and timeline.
Key Data Points to Notice
The layout is intentionally simple. The strike prices—the price at which you can buy (with a call) or sell (with a put)—are right down the middle, forming the spine of the grid. This makes it easy to see how the premiums change as you move further away from the stock's current price.
You'll also see different expiration dates listed, usually as tabs or a dropdown menu. When you click on one, the entire grid updates to show you only the contracts that expire on that specific day. This lets you switch between short-term weekly options and much longer-term contracts, known as LEAPS, with a single click.
An options chain isn't just a price list; it's a real-time map of market expectations. Once you know how to read it, you can move beyond just buying and selling stock and start building strategies based on price, time, and volatility.
Gauging Market Sentiment
Learning to interpret an options chain is a non-negotiable skill for any trader because it’s packed with clues about market sentiment. Each line gives you crucial data points like the last price a contract traded at, the current bid/ask spread, trading volume, and open interest.
A handy metric you can pull from this data is the put/call ratio. This simply compares the trading volume of puts to calls. A ratio below 1.0 often points to bullish sentiment (more traders are buying calls), while a ratio above 1.0 can signal bearishness. You can dig deeper into these kinds of stats with data from providers like the Cboe. This data isn’t static; it’s a living snapshot of supply, demand, and what traders are betting on next.
To get comfortable with the terminology, it helps to break down the main components you'll see on every options chain.
Here's a quick reference table to get you started.
Core Components of an Options Chain at a Glance
This table breaks down the essential terms you'll see on any options chain, giving you a quick reference to build your trading vocabulary.
| Component | What It Tells You | Why It Matters for Your Trade |
|---|---|---|
| Strike Price | The price where you agree to buy (call) or sell (put) the stock. | This is the core of your bet. It determines if your option is in-the-money, at-the-money, or out-of-the-money. |
| Expiration Date | The date when the option contract becomes void. | Time is a huge factor. Shorter-term options are riskier but cheaper; longer-term options give your trade more time to work out. |
| Bid/Ask | The current highest price a buyer will pay (bid) and the lowest price a seller will accept (ask). | The difference, or "spread," shows you the option's liquidity. A tight spread is good; a wide spread means it might be harder to get a fair price. |
| Last Price | The price at which the last trade for that contract occurred. | It’s a historical data point. Use it for context, but rely on the current bid/ask for real-time pricing. |
| Volume | The total number of contracts traded during the current day. | High volume indicates a lot of interest and liquidity, making it easier to enter and exit a position. |
| Open Interest (OI) | The total number of outstanding contracts that haven't been settled or closed. | This shows the depth of the market for that specific option. High OI means many traders have open positions. |
Think of these components as the building blocks of any options trade. Once you're comfortable identifying and understanding each one, you'll be able to scan an options chain quickly and spot potential opportunities with confidence.
Decoding Calls and Puts for Strategic Trades

Once you move past the basic definitions, reading an options chain stops being a technical exercise and becomes a strategic one. You’ll see the chain is split right down the middle—Calls on one side and Puts on the other. Each represents a totally different market outlook and serves a unique purpose in your trading toolkit.
Honestly, understanding why you'd choose one over the other is everything.
A call option gives you the right, not the requirement, to buy a stock at a set strike price. Traders use calls when they feel bullish and expect a stock's price to climb. Think of them as tools for speculation, letting you control a big chunk of shares for just a fraction of the cost of buying them outright.
Let's say a tech company is about to release a killer new product next month. You’re feeling optimistic and think the stock, currently at $150, will rocket past $160 after the news drops. Instead of forking over $15,000 for 100 shares, you could snag a call option with a $160 strike for a much smaller premium, maybe $200. If that stock does soar to $170, your option is suddenly very profitable, delivering a massive return on your small initial bet.
The Strategic Value of Calls
When you pick a call, you’re not just betting on which way the stock will go; you're also betting on how fast and how far. The best contracts usually find a sweet spot between cost and probability.
- For Aggressive Growth: A trader might grab an out-of-the-money (OTM) call. It’s cheaper, giving you more leverage if the stock makes a huge move. But it's also riskier since the stock has to get past the strike price just for you to break even.
- For Cautious Optimism: On the flip side, you could go for an in-the-money (ITM) call. It costs more, but it has a higher chance of succeeding and will move more in line with the actual stock price.
Puts for Profit and Protection
Now for the other side of the chain. Put options offer a cool duality. They give you the right to sell a stock at a locked-in strike price, which makes them powerful tools for profiting from a downturn and for protecting the stocks you already own.
If you think a stock is way overvalued and headed for a fall, buying a put lets you bet on its decline. Should the price drop below your strike, your put option's value goes up, and you profit from the downward slide. It's a direct way to act on a bearish hunch.
The real magic of puts, though, is how they work as portfolio insurance. A well-placed put can hedge your long stock positions against a sudden market dive, giving your investments a much-needed safety net.
Imagine you own 100 shares of a company but you’re nervous about an upcoming earnings report. By buying one put contract, you can lock in a minimum sale price for your shares. This caps your potential losses if the news turns out to be bad. It's a defensive move that’s a cornerstone of smart risk management.
For traders looking to see these strategies in action, checking out live options and futures trading sessions can be incredibly insightful, showing how pros apply call and put strategies in a fast-moving market.
Choosing the Right Strike Price and Expiration
Knowing what each column in an options chain means is one thing. Actually using that information to pick the right strike price and expiration date? That's where the real art of trading comes in. This single decision is where your strategy takes shape, turning a screen full of numbers into a calculated trade. It’s the difference between a random bet and a tactical position.
At its core, your choice boils down to the relationship between the strike price and the stock's current price. This determines if your option is in-the-money (ITM), at-the-money (ATM), or out-of-the-money (OTM). Each one has a completely different risk profile, making them better suited for different goals and market outlooks.
Balancing Risk and Reward
If you’re a more conservative trader, you might lean toward an ITM call option. Yes, it costs more because it already has intrinsic value, but that also gives it a higher probability of staying profitable. Its price will track the underlying stock more closely, giving you a steadier, more predictable path.
On the flip side, a speculator hunting for big returns might grab a cheap OTM call. This option has zero intrinsic value—it’s a pure bet on future price movement. For it to pay off, the stock has to make a serious move past your strike price before it expires. This makes it a high-risk, high-reward play that offers incredible leverage if you’re right.
The strike price you choose is a direct reflection of your conviction. It’s a tangible way of saying how far you believe a stock will move within a specific window of time.
The Critical Role of Time
Picking an expiration date is just as crucial. The time value of an option, often measured by the Greek letter Theta, bleeds away a little bit every single day. This decay gets faster and faster as the expiration date approaches, which is what makes short-term options so much riskier.
- Short-Term Expirations (Weeklies): These can offer explosive potential because of high gamma, but time is absolutely not on your side. Just a few days of the stock trading sideways can wipe out your entire premium.
- Long-Term Expirations (LEAPS): Contracts with months or even years left on the clock move much slower and are less sensitive to daily time decay. They give your trade idea more time to play out, but they also require more capital upfront.
Your choice should always match your forecast. If you're expecting a quick pop from an upcoming earnings announcement, a weekly option might be the right tool for the job. But if you’re bullish on a company’s fundamental growth over the next year, a LEAPS contract makes far more sense. For a deeper dive into this decision-making process, check out our complete guide on how to choose an option strike price.
This infographic pulls it all together, showing the key elements you need to consider when you're ready to make a trade.
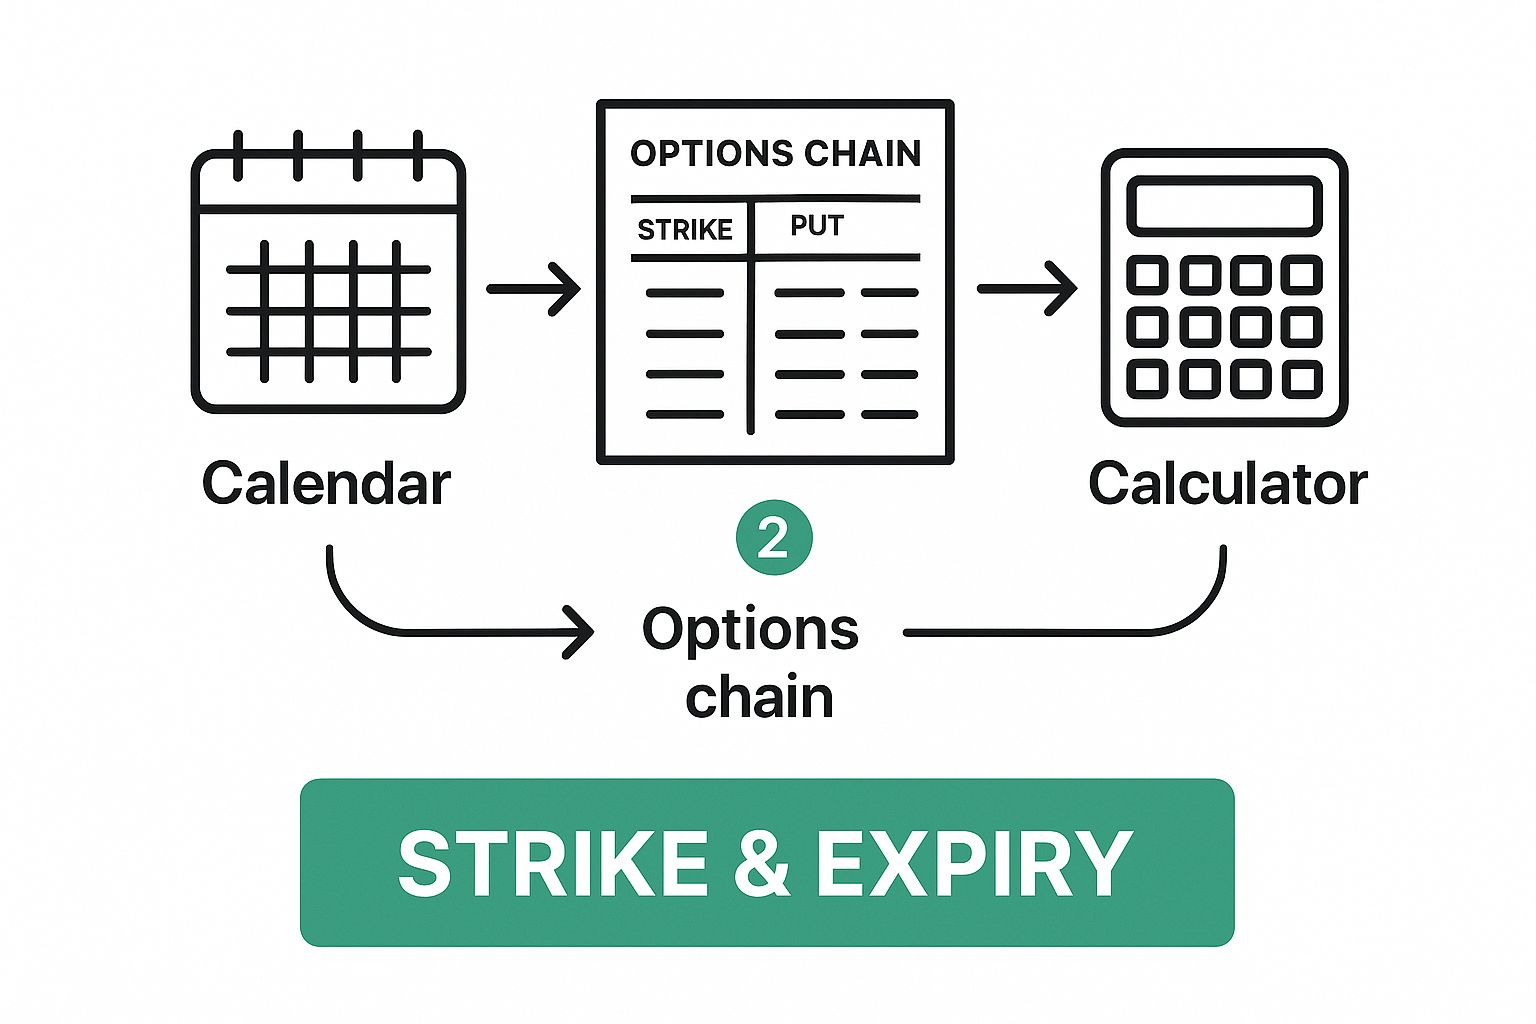
As the visual shows, it’s all a strategic balance between your market forecast, your personal risk tolerance, and your desired timeline. Making these decisions isn't just guesswork; it's informed by historical data. Since 1996, incredible records of daily option prices, volatilities, and the Greeks have been kept, helping traders analyze how contracts behave in all sorts of market conditions. This wealth of information, which accounts for corporate actions like stock splits and dividends, is what gives you precision when you evaluate a trade. You can learn more about how this historical data powers trading decisions with providers like OptionMetrics.
Once you have a handle on strike prices and expirations, it's time to dig into the next layer of the options chain. This is where you’ll find two of the most powerful clues for any trader: Volume and Open Interest (OI).
Think of these two columns as your direct window into what other traders are doing. It's like having an intelligence feed showing you exactly where the money and conviction are flowing in real-time.
Volume tells you the story of today. It’s the total number of contracts that have been bought and sold during the current trading session. High volume means there’s a ton of interest and liquidity, which makes it much easier to get in and out of a trade at a fair price.
Open Interest, on the other hand, tells a longer story. It’s the total number of option contracts that are still active—they haven't been closed, exercised, or expired. This number gives you a feel for the market's total commitment to a specific strike and expiration date.
The Powerful Duo: Volume and OI
The real magic happens when you look at Volume and Open Interest together. Their relationship reveals whether the day's trading frenzy is creating brand new positions or just closing out old ones. That's a critical distinction for figuring out the strength behind a potential move in the stock.
Here are the four scenarios you need to watch for:
- Rising Volume + Rising OI: This is a powerful signal. It tells you new money is flooding in, with traders opening fresh positions. This shows strong conviction.
- Rising Volume + Falling OI: This suggests traders are heading for the exits and closing out existing positions. It could be profit-taking or cutting losses, but either way, it often signals that a trend might be losing steam.
- Low Volume + Rising OI: New positions are being opened, but without the same urgency or conviction you'd see on a high-volume day. It's a sign of quiet accumulation.
- Low Volume + Falling OI: This points to a sleepy market. A few traders are closing positions, but there’s no significant pressure or major event driving the action.
When you spot a huge spike in volume at a specific strike, always check the Open Interest. If OI also jumps significantly the next day, it confirms that the volume was driven by new, confident bets—not just traders shuffling out of old positions.
Spotting "Unusual" Options Activity
This dance between volume and OI is exactly how you spot unusual activity, which often tips you off to what institutional or "smart money" players are doing. On some days, total option volume on U.S. exchanges can rocket past 58 million contracts. When you see volume for a particular stock that is dramatically higher than its 90-day average, it can be a huge red flag that a price swing is coming.
You can see these market-wide trends for yourself by checking out detailed reports on option volume at MarketChameleon.
For example, imagine a normally quiet stock suddenly sees 10,000 call contracts traded at an out-of-the-money strike, when its average volume is only 500. Something is definitely brewing.
By learning to read these clues in the options chain, you stop just looking at prices and start interpreting the market’s collective mind.
Making Sense of the Greeks to Manage Risk
If the main options chain is your map, then the "Greeks" are your real-time dashboard. They show you all the critical risk metrics for your trade as market conditions shift. Moving beyond just price and expiration is what separates beginners from seasoned traders, and the Greeks are where that happens.
Don't let the name intimidate you. These aren't just for math whizzes; they're practical tools you can and should use every day. Think of them as the vital signs of your option contract, telling you exactly how sensitive your position is to changes in the stock price, time, and overall market volatility.
Delta: The Speedometer
Delta is the first Greek most traders learn, and for a good reason. It’s your trade’s speedometer, telling you roughly how much your option's price will change for every $1 move in the underlying stock.
For example, a call option with a Delta of 0.60 is expected to gain about $0.60 in value if the stock price pops $1. On the flip side, it would lose roughly $0.60 if the stock drops by $1. Puts have a negative Delta (from -1 to 0) because their value goes up when the stock price goes down.
Delta also gives you a quick and dirty estimate of the probability that an option will expire in-the-money. That 0.60 Delta call has about a 60% chance of finishing ITM.
Gamma: The Accelerator
If Delta is your speed, Gamma is the accelerator pedal. It measures the rate of change of your Delta. A high Gamma means your Delta is going to change fast as the stock moves.
At-the-money options that are close to expiration have the highest Gamma. This is exactly why their prices can explode—or completely collapse—with even small moves in the stock. For traders, keeping an eye on Gamma is critical for understanding just how quickly your directional risk can ramp up.
The Greeks are not static numbers; they are constantly changing with every tick of the stock price and every passing minute. Understanding how they interact is the key to proactive trading.
Theta: The Time Thief
Theta is the one thing you can't escape when holding an option—it’s time decay. It tells you exactly how much value your option will lose each day, assuming the stock price and volatility don't change.
A Theta of -0.05 means your option's premium will lose about $5 per contract (0.05 x 100 shares) every single day. This decay isn't linear; it accelerates dramatically as you get closer to expiration, making time your worst enemy when you’re long options.
Vega: The Volatility Gauge
Finally, there’s Vega. It measures how sensitive your option is to changes in implied volatility (IV). Think of it as a gauge for market fear and greed. When IV spikes, option premiums get more expensive, and Vega tells you by how much.
Let's say an option has a Vega of 0.10. That means for every 1% jump in IV, your option’s price will increase by $0.10. This makes Vega a crucial metric to watch around big events like earnings announcements, when volatility almost always gets a massive jolt.
A solid grasp of these metrics is the cornerstone of effective options risk management and will help you avoid some nasty, and costly, surprises.
Answering Your Top Questions About Options Chains
Once you've got the basics down, you'll find that a few common questions always seem to surface. These are the details that separate theoretical knowledge from practical, confident trading. Let's walk through them.
Getting these concepts to click is the final piece of the puzzle. Once they do, you'll find yourself reading the chain faster and spotting opportunities you might have missed before.
What Does It Mean When an Option Is Shaded?
You've probably noticed that on most trading platforms, certain rows in the options chain are shaded or highlighted. This isn't just for looks—it’s a simple visual cue telling you which options are currently in-the-money (ITM).
It's a handy shortcut that saves you from doing the math.
- For calls, the shaded contracts are those with a strike price below the stock's current price.
- For puts, the shaded contracts have a strike price above the stock's current price.
This quick visual reference helps you instantly see which contracts have intrinsic value.
Key Takeaway: Shading is your platform’s way of saying, "Heads up, these options are currently in-the-money." Use it to quickly separate contracts with built-in value from those that are all fluff.
How Do I Know If an Option Is Liquid?
Liquidity is everything. It determines how easily you can get in and out of a trade at a fair price. Two key metrics on the options chain give you the answer.
First, look at the bid-ask spread. A narrow spread—just a few pennies wide—is a tell-tale sign of high liquidity. If you see a wide spread, that option is illiquid, and you'll likely get a terrible price when you try to trade it.
Second, check the Volume and Open Interest columns. Big numbers here are great signs. High volume means lots of contracts were traded today, while high open interest shows that many contracts are still active and held by traders. If an option has a wide spread and almost no volume, stay away. You could get stuck.
Why Is Implied Volatility (IV) Different for Every Strike?
You'll notice that implied volatility isn't a flat number across all strikes, even for the same expiration. This phenomenon is called the volatility smile or, more commonly, the volatility skew.
What's happening here? Typically, out-of-the-money (OTM) puts have a much higher IV. That’s because traders and institutions often buy these puts as portfolio insurance—a hedge against a sudden market crash. The constant demand for this "disaster insurance" bids up their prices, which in turn inflates their implied volatility.
This skew tells you something important: the market is pricing in a higher probability of a sharp drop than a sharp rally. For savvy sellers, this can be an opportunity. It's why a solid options income strategy often involves selling puts at strikes where the IV is pumped up by this market fear.
Which Expiration Date Should I Choose?
This is one of the most important questions a trader can ask, and the right answer depends entirely on your strategy and your outlook for the stock.
- Short-Term Catalysts: If you're trading around an event like an earnings report or a product launch, weekly expirations (or "weeklys") are your go-to. They are cheaper and offer more leverage, but be warned: time decay (Theta) is brutal.
- Longer-Term Trends: If you believe a stock is headed in a certain direction over the next few months, choose an expiration further out. These contracts, sometimes called LEAPS if they're a year or more out, are less sensitive to daily time decay and give your trade more breathing room.
Here's a good rule of thumb I've learned over the years: always give your trade more time than you think it needs. Time is an asset you can't get back once it's gone.
Ready to stop guessing and start making data-driven trades? Strike Price is the ultimate platform for options sellers who want to generate consistent income. Our real-time probability metrics help you find the perfect balance between premium and safety, while smart alerts warn you of risks before they become problems. Join thousands of traders earning smarter premiums. Turn your options strategy into a reliable income stream with Strike Price today.