A Trader's Guide to Real Time Options Data
If a stock moves past your strike, the option can be assigned — meaning you'll have to sell (in a call) or buy (in a put). Knowing the assignment probability ahead of time is key to managing risk.
Posted by
Related reading
Out of Money Call Options A Guide to Consistent Income
Learn how to use out of money call options to generate consistent income. This guide covers key strategies, risk management, and real-world examples.
How Options Are Priced A Practical Guide for Investors
Understand how options are priced with this clear guide. Learn about intrinsic value, implied volatility, and pricing models to improve your investing strategy.
Greek Options Explained for Income Traders
Unlock your options trading potential. This guide on greek options explained shows you how to use Delta, Gamma, and Theta to generate consistent income.
Ever tried to drive through rush hour traffic using a map that’s 15 minutes out of date? That’s exactly what it feels like to trade options without real-time options data. You’re making decisions based on where the market was, not where it is. It’s a risky game, and it puts you a step behind everyone else.
For any serious options seller, live data isn't a luxury—it's the lifeblood of your entire strategy.
What Is Real-Time Options Data?
At its heart, real-time options data is a live, tick-by-tick stream of everything happening in the market, delivered to your screen almost instantly. Forget the 15- to 20-minute delayed quotes you find on free financial websites. This is a high-definition, live picture of the market as it breathes.
But it’s so much more than just seeing a price update. This live feed is packed with granular details that are critical for making smart trades. You see every bid, every ask, and every trade the moment it happens. This gives you a clear window into market sentiment and liquidity—things that are absolutely essential for time-sensitive strategies like covered calls and cash-secured puts.
Timing isn't just important; it's everything. Instantaneous data empowers you to capture the best possible prices, turning potential near-misses into successful trades.
The Scale of Modern Market Data
The amount of information flowing through these feeds is staggering. Providers have to track millions of different options contracts across dozens of exchanges just to give you a complete picture. This requires a massive, powerful infrastructure built to process and deliver huge amounts of data with almost zero delay.
The scope of this data has exploded. Today, major providers source information directly from over 60 trading venues, including all 18 US equity options exchanges. This covers more than 3 million symbols, including 1.4 million US equity options contracts. The data includes everything from individual trades and the full order book to the National Best Bid and Offer (NBBO), giving traders an unparalleled view of the action. You can get a better sense of how this massive data infrastructure works over at Databento.com.
Key Components of Real-Time Options Data Feeds
So, what exactly are you getting in a real-time feed? It’s more than just a single price. Here’s a breakdown of the most critical pieces of information and why they matter so much to an options trader.
| Data Component | What It Tells You | Why It's Critical |
|---|---|---|
| Bid/Ask Prices | The highest price a buyer will pay (bid) and the lowest price a seller will accept (ask). | Shows the current supply and demand. A tight spread (small difference) means high liquidity. |
| Last Traded Price | The price at which the most recent trade was executed. | Confirms actual transaction prices, giving you a real-world anchor point. |
| Trade Volume | The total number of contracts traded during the day. | Indicates the level of interest and activity in a specific option. High volume means a more active market. |
| Open Interest | The total number of outstanding contracts that have not been settled. | Measures the total commitment of traders to an option, reflecting deeper market conviction. |
| Implied Volatility (IV) | The market's forecast of the likely movement in a stock's price. | Directly impacts the option's premium. Spikes in IV are opportunities to collect higher premiums. |
| The "Greeks" | Delta, Gamma, Theta, and Vega. | These metrics measure the option's sensitivity to price, time, and volatility changes, helping you manage risk. |
| NBBO | The National Best Bid and Offer across all exchanges. | Ensures you're seeing the best possible price available anywhere in the market, not just one exchange. |
Having all these components in real-time gives you a multi-dimensional view of the market, allowing you to move beyond simple price-watching and start trading with a real strategic edge.
Why Every Second Counts
For an options seller, a few seconds can be the difference between locking in a great premium and watching the opportunity vanish. Real-time data lets you spot those fleeting moments—like a brief spike in implied volatility that juices up the premium you can collect on a covered call.
Without it, you’re basically trading blind, reacting to ghosts of trades that have already happened. With it, you’re in the driver’s seat, equipped to make proactive decisions based on what’s happening right now.
Gaining an Edge with Covered Calls and Puts
For traders who generate income with covered calls and cash-secured puts, every single penny of premium counts. The entire game hinges on selling your options at the perfect moment to collect the most cash possible. This is exactly where real-time options data isn’t just a nice-to-have; it's a critical edge over using delayed information.
Think of it this way: trading on a 15-minute delay is like showing up to a flash sale after it's already over. The best deals are long gone. With live data, you see the sale the second it starts. You get instant access to the National Best Bid and Offer (NBBO), which means you're seeing the absolute best price available across all exchanges, not just some stale quote from minutes ago.
This lets you pinpoint the optimal moment to pull the trigger on a trade, maximizing your returns with almost surgical precision.
Capitalizing on Volatility Spikes
One of the most powerful ways to use real-time data is to spot and act on quick spikes in implied volatility (IV). As an option seller, higher IV is your best friend—it means juicier option premiums. The catch? These spikes are often incredibly brief, sometimes lasting only a few minutes.
A trader with a 15-minute delay might see that IV was high, but a trader with real-time data can sell into that spike as it happens, capturing a significantly larger premium for the exact same contract.
For example, a sudden piece of market-moving news can send IV soaring temporarily. If you're watching a live feed, you can immediately sell a covered call to lock in that inflated premium before it drops back to normal. This reactive ability translates directly into higher, more consistent income from your portfolio.
A Practical Scenario Selling Covered Calls
Let's walk through a real-world example. Imagine you own 100 shares of stock XYZ and you're ready to sell a covered call. You glance at your platform and see the premium for the strike you want is $1.50 per share, or $150 total.
But your real-time data feed is telling a different story. You see a surge of buying pressure in the Level 2 order book for that specific option, and you also notice implied volatility is ticking up. Instead of just taking the $1.50, you wait a few minutes.
Because you have a live view of the market, you watch the bid price climb to $1.65. You place your sell order and get filled, pocketing an extra $15 on a single trade.
That might not sound like a fortune, but when you compound that small edge over hundreds of trades a year, it makes a massive difference in your total returns. It's the difference between good results and great ones. To dig deeper into timing your trades, check out our guide on when to sell covered calls. This kind of consistent optimization is how successful options sellers turn their portfolios into reliable income-generating machines.
How to Interpret the Flow of Live Market Data

Getting your hands on a stream of real time options data is just the starting line. The real magic happens when you can interpret that constant flow of numbers and understand the story the market is telling you. Think of it like learning to read the tape—every tick, volume spike, and price shift is a word in a much bigger conversation about supply and demand.
Instead of getting swamped by all the noise, you can zero in on a few key live indicators. These signals help you move beyond just watching prices flicker and start understanding the market psychology that actually moves them. To really get good at this, it helps to master data analysis and business intelligence so you can spot the patterns that matter.
Decoding Key Live Indicators
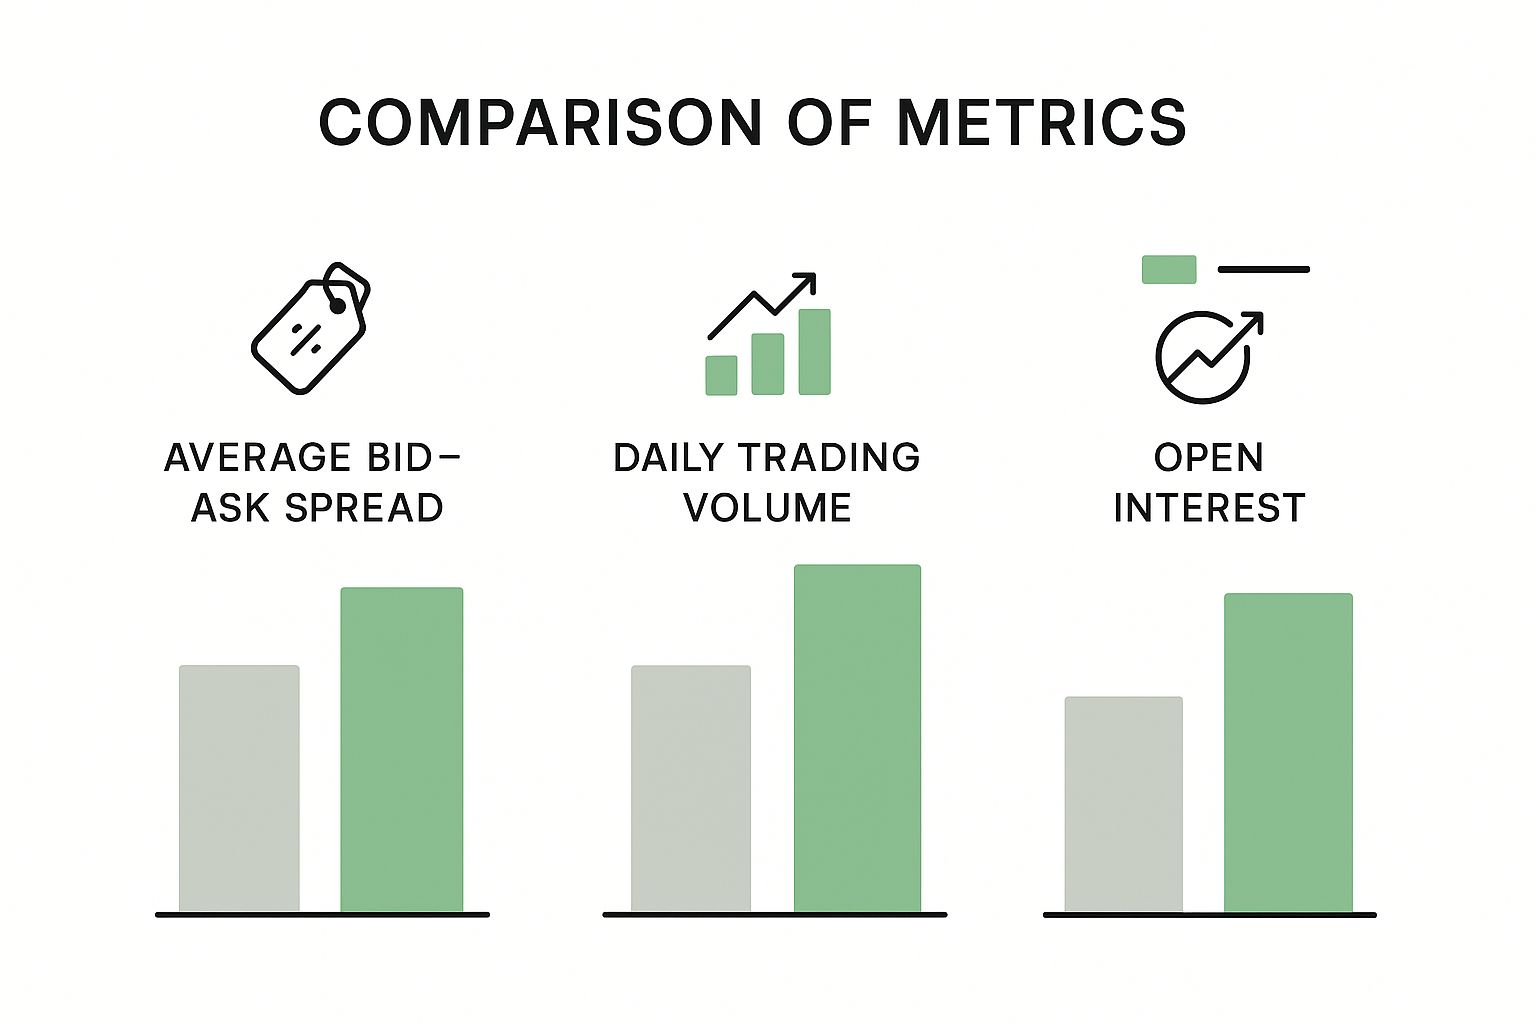
Imagine you’re watching a specific call option on your screen. All of a sudden, you see a massive surge in trading volume—way over its daily average. At the exact same time, you notice the bid-ask spread—the tiny gap between the highest buy price and the lowest sell price—is getting tighter.
That combination is a huge tell. The unusual volume suggests big players are making moves, while a tightening spread signals high liquidity and strong agreement on the price. For a call option, this often points to a wave of bullish sentiment building up before it even shows up in the stock’s price.
By learning to spot these patterns, you can anticipate market moves rather than just reacting to them. You're no longer just a spectator; you're actively reading the market's behavior and positioning yourself to act.
This kind of analysis is what separates guessing from informed decision-making. The volume and flow of options trading are powerful clues to market behavior. For example, on a recent trading day, the Chicago Board Options Exchange (Cboe) saw index option volume soar to over 2 million contracts by mid-afternoon. The put/call ratio was 0.98, showing an almost perfect balance between bullish and bearish bets. Seeing that volume build steadily all day shows exactly why granular, real-time feeds are so critical for catching those fast shifts in market mood.
The Put/Call Ratio as a Fear Gauge
Another metric you absolutely have to watch is the put/call ratio. This simple ratio just compares the total trading volume of puts (bearish bets) to calls (bullish bets). It’s basically a live "fear gauge" for the market or a specific stock.
Here’s the simple way to read it:
- A high or rising ratio suggests traders are buying more puts, signaling that fear or bearishness is on the rise.
- A low or falling ratio means more calls are being snapped up, pointing to growing confidence or bullishness.
Watching this ratio move in real time gives you a direct pulse on what the crowd is thinking, helping you figure out if a price move is being driven by genuine fear or pure optimistic speculation.
Finding Reliable Real-Time Options Data Sources
Getting your hands on high-quality real-time options data is a lot like choosing the right fuel for a race car—the source you pick makes all the difference. Not every data feed is the same, and settling for a slow or inaccurate one can mean watching great opportunities pass you by.
The world of data providers basically breaks down into three main camps. Your choice really boils down to what you need, from cost and speed to how you plan to act on the information. Whether you just need a clean, simple view for occasional trades or a direct, high-speed connection for an automated strategy, there’s a source built for you.
H3: The Three Main Types of Data Providers
Getting a handle on the different types of sources is the first step. Each one is built for a specific kind of trader and has its own clear pros and cons.
Integrated Brokerage Platforms: Think of platforms like TD Ameritrade's thinkorswim or Interactive Brokers' TWS. These are usually the first stop for retail traders because they wrap real-time data right into their trading software. It’s an all-in-one solution that’s convenient and often cheap (or free) for active clients.
Dedicated Data Providers: Companies like Polygon.io or Databento serve a more demanding crowd, like quants and developers. They offer raw, low-latency data feeds straight from the exchanges through APIs. This gives you maximum speed and flexibility to build your own custom tools.
Specialized Analytics Tools: This is where platforms like Strike Price fit in. We take that raw, real-time data and enrich it with powerful analytics—think probability metrics and risk alerts—and then present it in a user-friendly dashboard. It's designed specifically for strategies like selling covered calls and cash-secured puts.
This screenshot shows how a specialized tool can turn a flood of complex numbers into something you can actually use.
The clear visuals, showing probability and potential profit, help you make quick, data-backed decisions without having to be a programmer. Of course, seeing the data is just one part of the puzzle. You also have to understand how to choose the right option strike price to fit your strategy.
H3: Comparison of Real-Time Data Source Types
Choosing a data source can feel overwhelming, but breaking them down by their strengths and weaknesses makes the decision much clearer. The right fit depends entirely on your trading style, technical skill, and budget.
This table gives you a quick breakdown of the different types of data sources to help you figure out which one is right for your needs.
| Source Type | Best For | Key Advantage | Potential Drawback |
|---|---|---|---|
| Integrated Brokerages | Retail traders, beginners, and those who want an all-in-one solution. | Convenience and often low cost for active platform users. | Data may be slightly delayed or less granular; limited customization. |
| Dedicated Data Providers | Quantitative analysts, developers, and algorithmic traders. | Ultra-low latency, raw data, and maximum flexibility via APIs. | Can be expensive and requires technical expertise to implement. |
| Specialized Analytics Tools | Strategy-focused traders (e.g., covered call sellers). | Enriched, actionable data presented in a user-friendly interface. | Focused on specific strategies; may not cover all market needs. |
Ultimately, the goal is to find a source that delivers the information you need in a way that helps you make better, faster decisions. Whether that’s a built-in brokerage tool or a specialized app, the key is aligning the source with your personal trading goals.
Using Historical Data to Sharpen Real-Time Decisions

While real-time options data tells you what’s happening right now, historical data gives you the context to understand why it matters. Think of it like this: your real-time feed is your car’s speedometer, but historical data is the map of the road you've already traveled—complete with notes on sharp turns and speed traps.
When you blend these two together, you get a serious analytical edge. You stop just reacting to what the market does and start anticipating its next move. By looking at the past, you build a mental framework for how a specific option is likely to behave today.
Historical data turns your real-time feed from a purely reactive tool into a predictive one. It gives you the "muscle memory" to recognize patterns as they form, not after they've already happened.
This combination is also what makes backtesting your strategies possible. Let's say you regularly sell covered calls on a stock ahead of its earnings report. With historical data, you can go back and see exactly how its implied volatility typically behaved in the hours leading up to previous announcements. That's powerful stuff.
From Raw Data to Sophisticated Insights
Modern computing has completely changed the game for historical analysis. It's not just about looking at old closing prices anymore. Today’s data providers offer incredibly detailed historical datasets that are just as granular as a live feed.
You can now get your hands on deep historical options data that includes prices, sizes, and even advanced analytics like the Greeks (Delta, Gamma, Vega) and implied volatility surfaces. This info is often available in different snapshots—from end-of-day marks to intraday 5-minute intervals and even 1-minute bars. If you want to see how this data is structured, you can check out how providers like SpiderRock package their options greeks data.
Using Historical Greeks for Better Risk Modeling
Getting access to historical Greeks is a game-changer for building smarter risk models. It lets you see precisely how an option’s sensitivity to price (Delta), volatility (Vega), and time decay (Theta) shifted during past market events.
By studying this, you can build more robust models that answer critical questions like:
- How did this option's Delta react during the last big market dip?
- What was the typical Vega spike right before the last three product launches?
- How fast did Theta decay in the final week before the option expired?
This kind of historical insight adds a whole new dimension to your real-time analysis. It helps you make smarter, more confident decisions backed by evidence of how the market has behaved before.
Common Pitfalls When Using Live Data
Getting a constant stream of real time options data feels like a superpower. But like any powerful tool, it can backfire if you don't know how to handle it. That firehose of information, with prices and metrics flashing every second, can push traders into a few critical mistakes that completely sink their strategy.
One of the most common traps is analysis paralysis. You're staring at an overwhelming flood of data—every price tick, every volume flicker, every tiny shift in the bid-ask spread—and you just freeze. You end up waiting for that "perfect" signal that never actually arrives, and great opportunities just drift by while you're lost in the numbers.
Another big one is overreacting to market "noise." Small, meaningless price jumps are just a normal part of how liquid markets work; they don't always signal a real trend. If you react to every little fluctuation, you'll find yourself chasing prices, getting terrible trade fills, and racking up commissions on a string of bad decisions.
Staying Focused and Disciplined
To turn your data feed into a genuine asset, you have to learn to filter out the noise and zero in on what actually matters. That takes discipline and, most importantly, a plan you've made before the market opens. The goal is to stop reacting emotionally and start executing a clear strategy.
Here are a few actionable steps to help you avoid these pitfalls:
- Establish Predefined Rules: Before you even glance at the market, decide on your exact entry and exit criteria. Know precisely what conditions—like a specific implied volatility level or a certain premium amount—have to be met for you to make a move.
- Use Filters and Alerts: Don't try to watch everything at once. It's impossible. Use your platform’s tools to screen for specific option chains and set up alerts for your key levels. This lets the technology do the heavy lifting, pinging you only when your specific conditions are met.
- Confirm Your Signals: Never, ever act on a single indicator alone. If you see a big volume spike, check it against other signals—like a tightening spread or a change in the put/call ratio—before you pull the trigger.
The key is to let your strategy guide your use of data, not the other way around. By setting clear rules, you transform the data from a source of confusion into a tool for disciplined execution.
Mastering these habits is a huge part of effective options risk management. It’s what ensures your real-time data helps you execute your plan with precision, instead of luring you into costly, impulsive trades based on nothing but market noise.
Have More Questions? Let's Clear Them Up
Even with a solid game plan, diving into real-time options data can leave you with a few nagging questions. That’s perfectly normal. Here are some straight answers to the things traders most often ask when they’re looking to get a reliable edge.
Is Free "Real-Time" Data Good Enough?
This is a big one. While many brokers advertise "real-time" quotes for free, what you're often getting are snapshots—not the continuous, tick-by-tick stream of data that active traders need. For strategies like selling covered calls or puts where every penny of premium and every second counts, a paid, low-latency feed is a game-changer.
If you're a casual, long-term investor, the free data is probably fine. But if you’re actively selling options, you'll gain a massive advantage with professional-grade data that shows you the order book depth (what pros call Level 2 data) with almost no delay. It's the difference between seeing a photo of the market and watching a live video of it.
How Much Does Real-Time Options Data Cost?
The price tag really depends on what you need. For most retail traders, brokers like TD Ameritrade or Interactive Brokers bundle real-time data access right into their platforms. It's often free or a small monthly fee, which they'll frequently waive if you trade a certain amount each month.
If you're running a more institutional setup or need direct API access for custom tools, dedicated data providers can run anywhere from under a hundred to thousands of dollars a month. The cost really scales with how many exchanges you need data from and how deep you want to go.
Can I Actually Use This Data on My Phone?
Yes, absolutely. Most modern trading platforms have powerful mobile apps that give you full-on access to real-time options data. While nothing beats a multi-monitor desktop setup for a bird's-eye view, the apps are fantastic for keeping an eye on your positions and jumping on opportunities when you're on the move.
The real key is making sure your app of choice gives you the data points that matter to you. You'll want to see the full options chain, the Greeks, and trading volume to make smart moves right from your phone.
This kind of accessibility means you're no longer chained to your desk. You can manage your trades and react to the market from just about anywhere.
Ready to stop guessing and start building a data-driven options strategy? Strike Price delivers the real-time probability metrics and smart alerts you need to boost your income with confidence. Start your free trial today and feel the difference real data makes.