Using a Covered Call Profit Calculator to Maximize Your Income
If a stock moves past your strike, the option can be assigned — meaning you'll have to sell (in a call) or buy (in a put). Knowing the assignment probability ahead of time is key to managing risk.
Posted by
Related reading
Out of Money Call Options A Guide to Consistent Income
Learn how to use out of money call options to generate consistent income. This guide covers key strategies, risk management, and real-world examples.
How Options Are Priced A Practical Guide for Investors
Understand how options are priced with this clear guide. Learn about intrinsic value, implied volatility, and pricing models to improve your investing strategy.
Greek Options Explained for Income Traders
Unlock your options trading potential. This guide on greek options explained shows you how to use Delta, Gamma, and Theta to generate consistent income.
A covered call profit calculator is a tool that turns strategic guesswork into clear, data-driven decisions. It crunches the numbers for you—factoring in your stock's cost basis, the option's strike price, and the premium you collect—to show you potential profit, loss, and your all-important breakeven point. This gives you a complete financial picture before you ever place a trade, helping you manage risk and generate income with a lot more confidence.
Why a Calculator Is Your Most Essential Covered Call Tool
Let's be honest, covered calls seem simple on the surface. You own at least 100 shares of a stock, sell a call option against them, and pocket the premium. But the second you try to nail down your exact profit if the market zigs or zags, that simplicity starts to fade.
This is exactly where a dedicated covered call profit calculator becomes your best friend.
This tool does more than just basic math; it gives you strategic foresight. By quickly modeling different outcomes, you can instantly see how a higher strike price or a later expiration date might change your return. That clarity is absolutely critical for making smart decisions, especially when the market gets choppy.
Moving from Guesswork to Data-Driven Decisions
Without a calculator, you’re flying blind. You might be leaving money on the table or, worse, taking on risks you didn't even see coming. The tool gives you a systematic way to weigh the trade-offs of any covered call position.
It answers the big questions before you commit a single dollar:
- Is this premium really worth the risk? You can finally weigh the income you’ll generate against the chance of having your shares called away.
- Where's my true breakeven point? Knowing this exact price helps you set realistic expectations and manage your position if the stock price decides to drop.
- Does this trade actually fit my income goals? By calculating the potential return on investment, you can see if a specific trade helps you hit your weekly or monthly targets.
This analytical approach is a huge step up from just going with your gut. It's what separates casual option sellers from traders who consistently and systematically build their income streams. If you're looking to build that foundation, our guide on how to sell covered calls for income is a great place to start.
A classic rookie mistake is focusing only on the premium collected. A calculator forces you to see the whole picture—potential capital gains (or losses) and your breakeven safety net. It's a full risk assessment in seconds.
The Strategic Edge in Different Market Conditions
Covered calls have long been a go-to for income investors, but their effectiveness really depends on the market. From the end of 1995 through recent years, the CBOE S&P 500 BuyWrite Index delivered an annualized return of just 6.6%, lagging the S&P 500's 9.2%. That gap gets even wider in roaring bull markets.
This is why tools like covered call profit calculators are such a game-changer for individual traders. By plugging in different strike prices, volatilities, and expiration dates, you can model these trade-offs in real-time and adapt your strategy.
A calculator helps you pivot. In a flat or slightly bullish market, you can pinpoint strikes that offer a solid premium with a low probability of your shares getting called away. In a volatile market, it helps you find that sweet spot between a fat premium and a breakeven point that lets you sleep at night. It turns market noise into actionable data.
Breaking Down the Core Covered Call Profit Formulas

Ever wonder what a covered call calculator is really doing under the hood? While they’re fantastic for getting a quick, accurate answer, understanding the simple math behind them gives you a much deeper, more intuitive feel for your trades.
When you know the formulas, you can size up opportunities on the fly. At its core, any calculator is just running a few key equations. Let’s pull back the curtain and look at the engine driving your profit calculations.
Calculating Your Maximum Potential Profit
First up is the big one: your maximum profit. This is the absolute best-case scenario, the most you can squeeze out of a trade. It happens when the stock price climbs to or past your strike price by expiration, and your shares get "called away."
The formula itself is pretty straightforward:
Maximum Profit per Share = (Strike Price - Stock Purchase Price) + Premium Received
Let’s use a real-world example. Say you bought 100 shares of XYZ stock at $45 a share. You then sell one call option with a $50 strike price, collecting a $2 per share premium ($200 total).
- Capital Gain: $50 (Strike) - $45 (Purchase Price) = $5 per share
- Add the Premium: $5 + $2 = $7 per share
- Total Max Profit: $7 x 100 shares = $700
This calculation shows your total upside, combining the income from the option premium with the stock's appreciation up to the strike. A calculator just does these steps for you instantly.
Finding Your Return If Unassigned
So what happens if the stock doesn't hit the strike price? This is a super common—and often ideal—outcome for income-focused traders. If the stock closes below your strike at expiration, the option expires worthless. You keep your shares, and that premium you collected is pure profit.
This is your "return if unassigned," and it's a key metric for judging the income-generating power of the trade.
The formula is dead simple:
Return If Unassigned = (Premium Received / Stock Purchase Price)
Using our same XYZ stock example:
- Premium Received: $2 per share
- Stock Purchase Price: $45 per share
- Calculation: ($2 / $45) = 4.44%
This means you generated a 4.44% return on your capital in the time until expiration, just from the option premium. This is the figure many traders use to compare different strike prices or expiration dates to hunt for the best income opportunity. It’s also worth remembering that the premium is made up of different components; understanding extrinsic option value can really sharpen your strategy here.
Uncovering Your Breakeven Point
This might be the most critical calculation for managing your risk: the breakeven point. This is the stock price where you start to lose money on the combined position. That premium you collected acts as a valuable cushion, lowering your effective cost basis.
Here’s how you find that price:
Breakeven Price = Stock Purchase Price - Premium Received
Applying it one last time to our XYZ trade:
- Stock Purchase Price: $45 per share
- Premium Received: $2 per share
- Calculation: $45 - $2 = $43 per share
This means the stock could fall all the way to $43 before you're in the red. The $2 premium gives you a buffer against a minor downturn. Any price above $43 at expiration, and you've made a profit.
To get the full picture of your potential outcomes, it's a good idea to get comfortable with how to calculate investment returns using clear, repeatable methods. These three core formulas are the engine inside every covered call calculator, turning what seems complex into simple, actionable numbers.
How Real-World Scenarios Play Out
The formulas are one thing, but seeing how covered calls perform in the wild is where the real learning kicks in. Theory is great, but the true test comes when your money is on the line in a market that doesn't care about spreadsheets. Let’s walk through three common scenarios to see how the numbers actually work.
To keep it simple, we'll use a hypothetical stock, "Innovate Corp" (ticker: INVT), for each example.
Scenario 1: Stock Rises and Gets Assigned
This is what most people consider the "max profit" outcome. It's a great result, but it perfectly illustrates the core trade-off of covered calls: you cap your upside potential in exchange for that immediate premium income.
Here's the setup. You bought 100 shares of INVT at $120 per share. You decide it's a good time to sell a call and bring in some cash.
- Your Position: 100 shares of INVT at a cost basis of $120.
- The Trade: You sell one call option with a $125 strike price that expires in 30 days.
- Premium Collected: You immediately get $3.00 per share, putting $300 in your account.
Fast forward a few weeks. INVT has a great month, and the stock price rallies to $128 per share by expiration. Since the stock is above your $125 strike, the option is exercised. Your 100 shares are automatically sold at $125 each.
A covered call calculator would break it down like this:
- Capital Gain: ($125 Strike Price - $120 Cost Basis) = $5.00 per share.
- Premium Income: $3.00 per share.
- Total Profit: $5.00 + $3.00 = $8.00 per share.
- Net Profit: $8.00 x 100 shares = $800.
Sure, you missed out on that extra $3 of appreciation between $125 and $128. But you successfully locked in your maximum possible gain for the trade. The numbers confirmed an $800 profit—a solid 6.67% return on your initial $12,000 investment in just one month. Not bad at all.
Scenario 2: Stock Stays Flat and the Option Expires Worthless
This is the dream for pure income generation. You collect the premium, keep your shares, and get to do it all over again.
The setup is identical. You own 100 shares of INVT at $120 and sell the same $125 call option for a $3.00 per share premium.
This time, the market is sleepy. INVT trades sideways, and at expiration, the stock price is sitting at $122 per share. Since that’s below the $125 strike, the option simply expires worthless.
Here’s what happens:
- The Outcome: The option is out-of-the-money (OTM). You keep your 100 shares.
- The Profit: Your only profit is the $300 premium you collected upfront.
A covered call calculator shows this as your "Return if Unassigned." In this case, your return for the month is 2.5% ($300 premium / $12,000 stock cost). It’s pure income, and you’re now free to sell another call for the next month to keep the cycle going. Our guide on covered calls examples digs into even more situations like this one.
Key Takeaway: This scenario is the bread and butter of covered calls for income. You're creating a cash flow stream from your stocks that doesn't depend on them going up in price.
Scenario 3: Stock Dips but Stays Above Breakeven
Finally, let's look at what happens when the stock moves against you. This is where the premium you collect acts as a vital cushion, protecting your position from a small downturn.
Again, same starting point: 100 shares of INVT at $120, and you sell the $125 call for a $3.00 premium. A good calculator will instantly show your breakeven point is $117 per share ($120 cost basis - $3 premium).
During the month, some bad news hits the tech sector, and INVT's stock drops to $118 per share at expiration. The option expires worthless since it's far below the $125 strike.
Here's how your position nets out:
- Stock Position: You have an unrealized loss of $2.00 per share on your stock ($120 - $118).
- Option Profit: You keep the full $3.00 per share premium.
- Net Result: Your $3.00 profit from the option more than cancels out the $2.00 paper loss on the stock.
- Total Profit: $3.00 - $2.00 = $1.00 per share, for a total net gain of $100.
If you had just held the stock, you'd be sitting on a $200 unrealized loss. The $300 premium didn't just erase that loss; it turned the trade into a modest winner. This protective buffer is one of the most powerful parts of the strategy.
These scenarios show just how flexible a covered call strategy can be. Let's summarize the potential outcomes in a table.
Covered Call Scenario Outcomes
This table breaks down the profit and loss calculations for the three common scenarios we just walked through, showing how different market movements affect your bottom line.
| Scenario | Stock Price at Expiration | Outcome | Profit/Loss Calculation | Net P/L per Share |
|---|---|---|---|---|
| Stock Assigned | $128 | Shares sold at $125 | ($125 - $120) + $3 Premium | +$8.00 |
| Expires OTM | $122 | Keep shares, option expires | $3 Premium only | +$3.00 |
| Stock Dips | $118 | Keep shares, option expires | ($118 - $120) + $3 Premium | +$1.00 |
As you can see, the premium income significantly alters the final P/L in each case, either by adding to gains or cushioning against losses.
This same logic scales up, even to more frequent trading. A newer approach using daily options has shown impressive results, with the S&P 500 Daily Covered Call Index posting an annualized yield of 10.80% since it launched in October 2023. This shows why calculators are so important for forecasting dynamics—by plugging in daily volatility and time decay, you can see how modern platforms can guide strike selection for these fast-moving scenarios. You can discover more insights about this strategy from ProShares.
Factoring in the Hidden Costs of Trading
The raw profit from a covered call—the premium you collect plus any stock gains—is a great starting point, but it's not the number that actually hits your account. To get a real sense of what you've earned, you have to look past the initial figures and account for the costs that inevitably chip away at your returns.
Ignoring these expenses is like getting excited about a salary offer without thinking about taxes; your take-home pay will be a rude awakening. The most obvious costs are brokerage commissions and trading fees, which can vary wildly from one platform to another.
Even with "commission-free" trading, certain accounts or specific actions can still trigger fees. You need to factor in the cost to buy the stock, sell the option, and sometimes, a fee for having your shares called away. While small on a single trade, they can easily add up over a year.
The Impact of Commissions and Fees
Let's make this real. Imagine you sell a covered call and collect a $50 premium. If your broker charges a $0.65 per-contract fee to open the trade and another $0.65 if it gets assigned, your net premium instantly drops to $48.70.
That $1.30 might not seem like much, but it's 2.6% of your gross premium. If you're running a strategy with lots of trades on smaller premiums, those fees can take a serious bite out of your annualized returns. Always know your broker's full fee schedule, including any sneaky assignment or exercise fees.
This chart shows how a covered call plays out in different market scenarios, which is the foundation for figuring out your final, net profit.
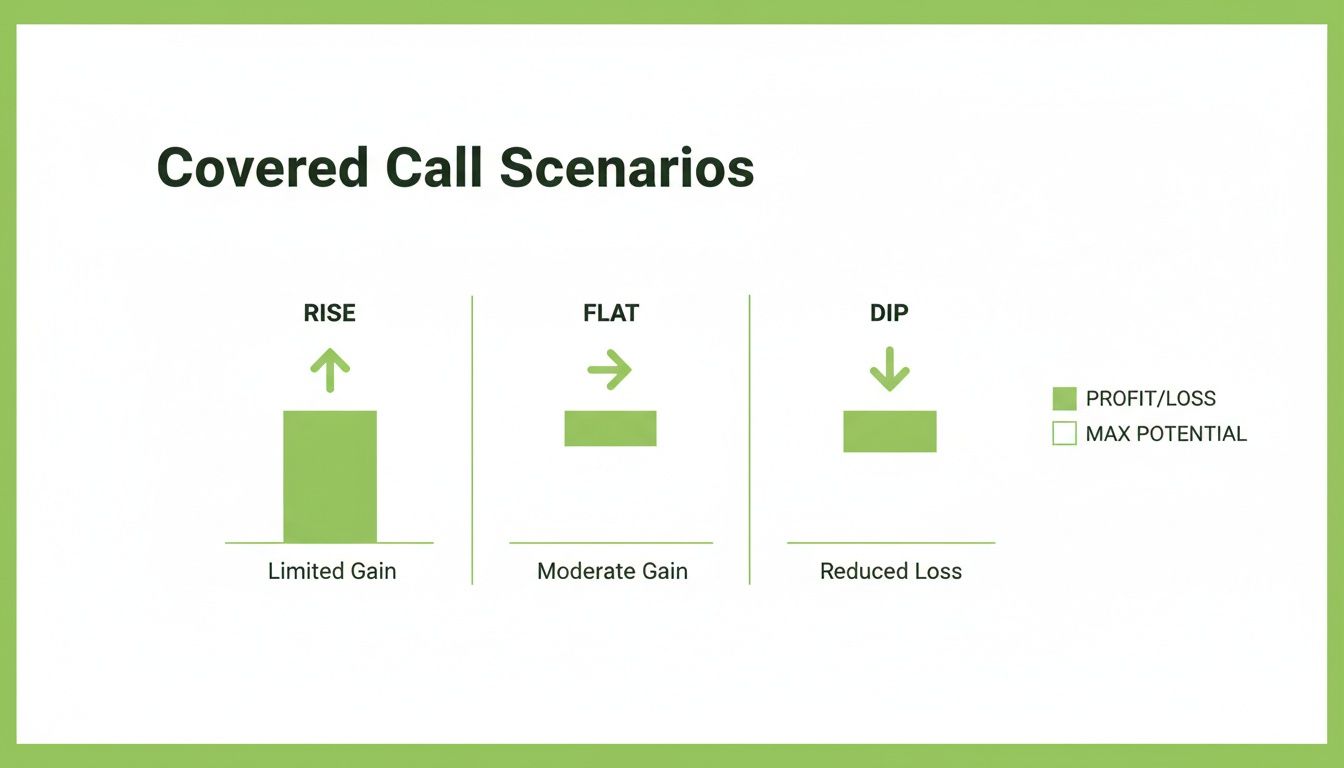
As you can see, you can make money when the market is rising, flat, or even dipping slightly—but the final number always comes down to accounting for those hidden costs.
Navigating Tax Implications
Beyond fees, taxes are the biggest "hidden cost" you'll run into. The way covered call profits are taxed can get complicated, and it really all depends on whether your shares get called away.
Here’s a quick breakdown of what to keep in mind:
- If the Option Expires Worthless: The premium you pocketed is considered a short-term capital gain. That means it gets taxed at your regular income tax rate, no matter how long you've owned the stock.
- If the Stock is Called Away: This is where it gets a little trickier. Your total profit is (Strike Price + Premium) - Stock's Cost Basis. The tax rate on that profit depends on how long you held the stock. More than a year? It's a long-term capital gain. A year or less? It's short-term.
A critical trap to avoid: selling certain covered calls can actually pause your stock's holding period for tax purposes. Selling an in-the-money call, for instance, can stop the clock. This could turn what you thought was a long-term gain into a short-term one if the stock is assigned.
This difference is huge. Long-term capital gains get taxed at much friendlier rates (0%, 15%, or 20% for most people) than short-term gains. A good covered call calculator won't figure out your exact tax bill, but it gives you the gross profit numbers needed to get a close estimate. When in doubt, it's always smart to talk to a tax professional about your specific trades.
Turning Calculator Insights Into Smarter Trades
A covered call profit calculator does more than just spit out numbers—it’s a powerful decision-making engine. The real skill is bridging the gap between calculation and execution, turning that raw data into a smarter, more strategic trade.
This is where you transform numbers on a screen into a refined trading plan.
The figures your calculator gives you—breakeven point, max profit, return if unassigned—are strategic signals. They guide your every move, from picking the right strike price to managing your position if the market turns sideways.
Using Breakeven as a Risk Management Tool
One of the most practical things a calculator does is show your breakeven price instantly. This isn't just a number; it's your line in the sand. It tells you exactly how much of a cushion the premium gives you against a drop in the stock price.
Let's say you bought a stock at $50 and sell a call for a $2 premium. Your calculator will instantly show a breakeven of $48. Knowing this lets you set a mental stop-loss or an alert with more confidence. If the stock dips toward $48, you know your buffer is shrinking, which should prompt you to re-evaluate the position.
Your breakeven point is your first line of defense. It quantifies your downside protection and turns risk management from a vague feeling into a precise, actionable data point.
This kind of precision is critical, especially in larger portfolios. With portfolio managers eyeing up to $15 trillion in concentrated stock positions for these kinds of overlay strategies, the need for exact calculation is massive.
For a $100 stock with a $105 call sold for a $2 premium, a calculator instantly reveals a potential 15-20% annualized return if the stock stays flat, but only 5% if it gets called away. Understanding these nuances is why tools like Strike Price are so effective—they integrate live data for real-time calculations.
Comparing Strikes to Find the Income Sweet Spot
A covered call calculator really shines when you use it to compare different scenarios. Should you sell a strike closer to the current stock price for a bigger premium, or go with a farther out-of-the-money (OTM) strike for less premium but a lower chance of assignment?
Instead of guessing, you run the numbers.
- Closer Strike: Higher premium, higher "return if unassigned," but also a higher probability your shares get called away.
- Farther Strike: Lower premium, lower immediate return, but a much better chance you'll keep your shares and can rinse and repeat next month.
By plugging both options into the calculator, you can directly compare the annualized return if unassigned versus the max profit if assigned. This lets you find the trade-off that best fits your goals, whether that’s maximum monthly income or long-term stock appreciation.
Evaluating Profit Versus Opportunity Cost
Finally, the "max profit" calculation forces you to confront the central trade-off of covered calls: opportunity cost. The calculator tells you the absolute most you can make on the trade. Your job is to decide if that capped profit is worth giving up any potential gains beyond the strike price.
If you’re extremely bullish on a stock and think it could surge 20% next month, selling a covered call that caps your gain at 5% might not be the best move. The calculator makes this trade-off crystal clear.
It helps you answer the ultimate question: does this premium adequately compensate me for the risk of missing out on a major rally?
To truly optimize your capital allocation and maximize long-term growth, insights from tools like a Kelly Criterion calculator can provide an even deeper analytical layer to your decision-making. By transforming calculator outputs into strategic actions, you move beyond simple income generation and start actively managing your portfolio for optimal returns.
Common Questions About Covered Call Math
Once you start plugging numbers into a covered call profit calculator, the real-world questions quickly follow. The tool gives you the raw output, but knowing what to do with those numbers is what separates a decent trade from a great one.
Think of this as the FAQ for your trading brain. These are the details that shift you from just running calculations to truly mastering the strategy.
How Do I Adjust for an Early Assignment?
Getting assigned early can feel like a curveball, but it's often a good thing. From an income perspective, it can be a huge win. While your maximum profit per share doesn't actually change, the key difference is that you realized that profit in a much shorter time.
This can send your annualized return on investment (ROI) through the roof. When that assignment notice hits, the core profit calculation is the same, but you need to recalculate your return using the new, shorter holding period. A good calculator makes it simple to model this accelerated return, which is a critical metric for any trader focused on consistent cash flow.
How Does Implied Volatility Change My Profit?
Implied volatility (IV) is one of the biggest drivers of an option's price, and it has a direct impact on your bottom line. For a covered call seller, higher IV means richer option premiums. That's fantastic news.
When you use a covered call profit calculator, you'll see this play out instantly:
- Higher Potential Profit: A fatter premium automatically increases your maximum potential profit.
- Lower Breakeven Point: The bigger credit you receive acts as a larger downside cushion, lowering the price the stock can fall to before the trade goes into the red.
This is exactly why so many traders hunt for opportunities to sell covered calls when IV is high. It lets them pull in maximum income while building a bigger margin of safety into the trade from day one.
High IV is like getting paid extra to take on the same stock risk. It supercharges your premium and pads your breakeven, creating a much better risk-reward profile right from the start.
Can I Use This Calculator for a Poor Man's Covered Call?
Nope. A standard covered call profit calculator is the wrong tool for a Poor Man's Covered Call (PMCC). Even though the name is similar, the mechanics underneath are completely different. A PMCC uses a long-term option (a LEAPS contract) as a stand-in for owning 100 shares of stock.
This structure adds layers of complexity that a simple calculator just isn't designed for. You have to account for the upfront cost of the LEAPS, the delta of both your long and short options, and how time decay (theta) affects each contract differently.
The breakeven for a PMCC is a different beast: Long Call Strike Price + Net Debit Paid. To get an accurate picture of the unique risks and rewards of this diagonal spread, you really need a more specialized options strategy calculator.
What's the Best Expiration Date to Maximize Profit?
This is a classic question, and the answer always comes down to a trade-off between how often you want to get paid and how big you want each paycheck to be. There's no single "best" date—it all depends on your personal strategy.
- Shorter-Term Options (Weeklies): These often produce a higher annualized return. You're collecting smaller premiums, but you're doing it more often and taking full advantage of rapid time decay.
- Longer-Term Options (30-45 Days): These give you a larger chunk of cash upfront and more time for the trade to work out. The trade-off is that the annualized return is usually lower compared to compounding weekly premiums.
A covered call profit calculator is the perfect tool for this debate. You can model both scenarios side-by-side to see which path fits your risk tolerance and income goals. It lets you make a data-driven choice between higher frequency or higher upfront cash.
Ready to stop guessing and start making data-driven decisions? Strike Price gives you the real-time probability metrics you need to find the perfect balance between premium income and safety. Turn your trading strategy into a consistent income stream.