Your Guide to Greek Options Trading for Income
If a stock moves past your strike, the option can be assigned — meaning you'll have to sell (in a call) or buy (in a put). Knowing the assignment probability ahead of time is key to managing risk.
Posted by
Related reading
Out of Money Call Options A Guide to Consistent Income
Learn how to use out of money call options to generate consistent income. This guide covers key strategies, risk management, and real-world examples.
How Options Are Priced A Practical Guide for Investors
Understand how options are priced with this clear guide. Learn about intrinsic value, implied volatility, and pricing models to improve your investing strategy.
Greek Options Explained for Income Traders
Unlock your options trading potential. This guide on greek options explained shows you how to use Delta, Gamma, and Theta to generate consistent income.
If you're selling options for income, you've probably wondered how to measure the risks and rewards of a contract before you jump in. That's where the Greeks come in. Think of them as the instrument panel for your trading portfolio, giving you real-time feedback on how your positions will react to market changes.
Price shifts, time ticking away, and sudden volatility spikes all affect your bottom line. The Greeks help you see it coming.
Decoding Your Options Trading Dashboard
Instead of flying blind, savvy income investors use the Greeks to navigate the options market with a bit more precision. These five key metrics can help turn trading from a pure guessing game into a more data-driven strategy for generating consistent income.
Each Greek answers a critical "what if" question about your position, helping you measure risk and predict how your contract's value will behave under different conditions. Of course, to make any of this work, you first need to know how to read an options chain. That's the foundation for applying any of these insights.
The Core Metrics of Greek Options Trading
At its heart, understanding the Greeks is about managing the primary forces that influence an option's price. For anyone selling covered calls or secured puts, mastering these concepts is key to aiming for more predictable returns.
The main Greeks you'll run into on any trading platform are:
- Delta: How sensitive is my option to the stock's price movement?
- Gamma: How fast will my Delta change as the stock moves?
- Theta: How much value am I losing to time decay each day?
- Vega: How will a change in market fear (volatility) affect my option's price?
This concept map shows how each Greek represents a different risk factor you need to keep an eye on, all radiating from a central dashboard.
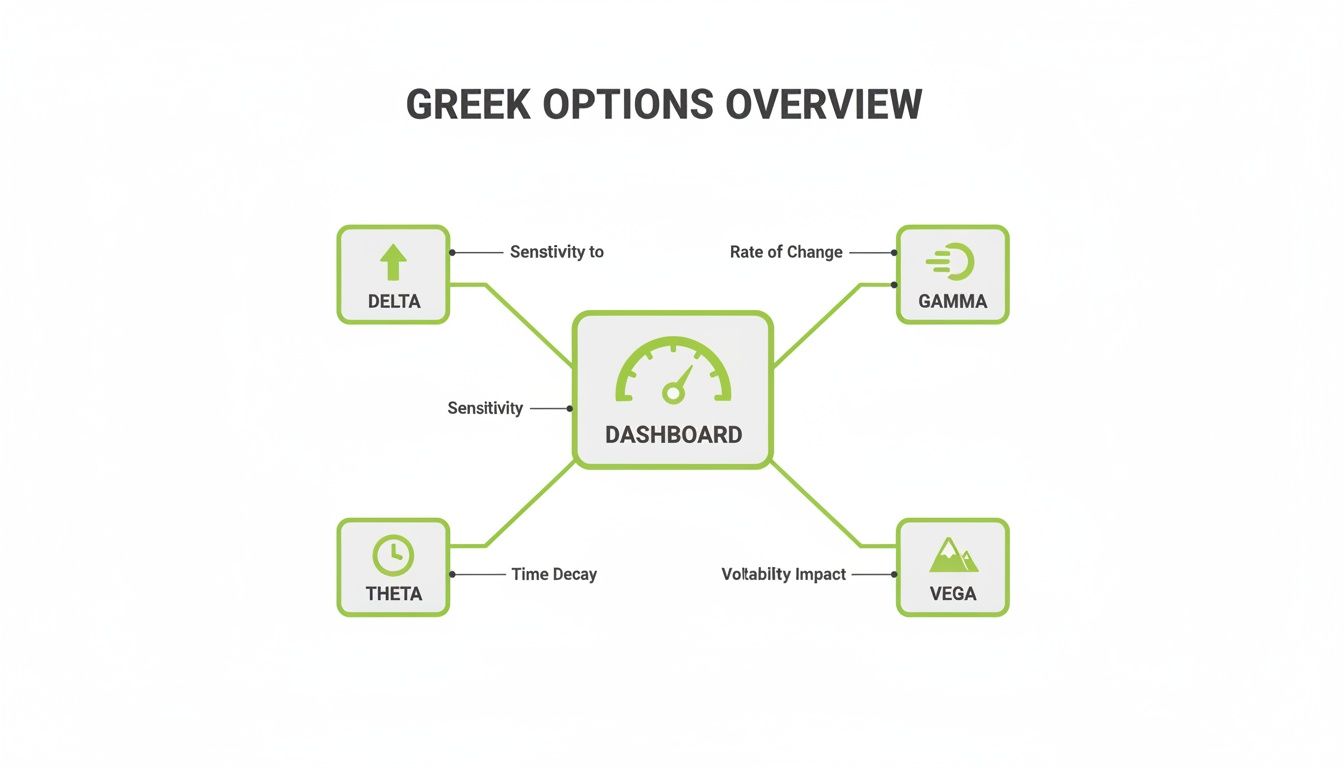
As you can see, a complete dashboard integrates these distinct but interconnected metrics to give you a full picture of your position's risk profile. While metrics like volume and open interest give you clues about market activity, the Greeks offer a deeper look into the why behind price changes. You can learn more about those differences right here: https://strikeprice.app/blog/open-interest-vs-volume-options.
Why the Greeks Matter for Income Investors
For income-focused traders, the goal isn't to speculate wildly. It's to generate consistent cash flow by selling contracts month after month. The Greeks are your best allies in this effort, helping you select trades that actually align with that goal.
A solid grasp of the Greeks allows you to quantify risk rather than just "feel" it. You can see exactly how much you stand to gain from time decay versus how much you might lose from a sudden price swing. That's how you build a more resilient portfolio.
This guide will break these concepts down—not as complex formulas, but as practical tools you can use every day. We'll use clear analogies and real-world examples to explain how each Greek helps you measure risk, forecast price movements, and make smarter decisions for your income goals.
Understanding Price Movement with Delta and Gamma
When you’re looking at your options dashboard, Delta and Gamma are the two Greeks that immediately tell you how your position will react if the stock price moves.
Think of it like this: Delta is the speedometer of your option, and Gamma is its accelerator. Getting these two down is the first step to really understanding how to manage your trades.
Delta: The Speedometer of Your Option
Delta tells you how much your option's price should change for every $1 move in the underlying stock. It's the most straightforward measure of an option's sensitivity to price changes.
For example, if you own a call option with a Delta of 0.40, its price will go up by about $0.40 for every $1 the stock climbs. If the stock falls by $1, your option's price will drop by that same $0.40. It’s that simple.
Metrics like Delta and Gamma became the bedrock of modern options trading after the Black-Scholes formula came along, giving traders a standardized way to price and manage risk.
For those of us selling covered calls and secured puts, Delta is also an incredibly useful shortcut for estimating the probability of an option expiring in-the-money. A Delta of 0.40 suggests there's roughly a 40% chance the option will finish in-the-money. This turns what could be a gut feeling into a data-driven decision.
Using Delta for Income Strategies
If you're an income investor selling covered calls or secured puts, Delta does double duty. It’s not just about tracking price—it’s about gauging risk.
Covered Call Example: You own 100 shares of XYZ, trading at $100. You sell a call with a $110 strike price that has a Delta of 0.25. That 0.25 Delta gives you a quick read: there's an approximate 25% chance of the stock closing above $110 by expiration. Now you can actually quantify the risk of having your shares called away.
Secured Put Example: You want to buy XYZ, but only if it drops to $90. You sell a put with a $90 strike and a Delta of -0.20. Ignoring the negative sign, that 0.20 Delta tells you there’s roughly a 20% chance the stock will fall below $90, and you’ll be on the hook to buy the shares.
Platforms built for options sellers are designed to put Delta front and center to make this kind of risk check intuitive.

This kind of clean interface translates all that complex Greek data into simple, actionable probabilities. It lets sellers see the risk-reward tradeoff for any strike price at a glance.
For a deeper dive, check out our guide on how to use Delta in option trading.
Gamma: The Accelerator Pedal
So, if Delta is your option's speed, Gamma is the accelerator. It measures how quickly that speed (Delta) changes.
An option with high Gamma is like a sports car—its Delta can change in a hurry. On the other hand, an option with low Gamma is more like a cruise ship, with a stable, predictable Delta that doesn’t move around too much.
For income sellers, low Gamma is usually your friend. A stable Delta means fewer surprises and a more predictable position. It cuts down on the need to constantly watch your trades as the stock price bounces around.
High Gamma tends to pop up when options are:
- At-the-money: Strike prices that are very close to the current stock price.
- Nearing expiration: Gamma risk really ramps up in the final days and weeks before an option expires.
Let’s go back to our covered call example. The stock, XYZ, is trading at $100. If it suddenly jumps to $109, the Delta on your $110 call might leap from 0.25 to 0.45. That acceleration? That’s Gamma at work.
Suddenly, your risk of assignment is much higher, and Gamma is the Greek that warns you about that potential instability. By keeping an eye on both Delta and Gamma, you can do a much better job of picking and managing positions that fit your income goals and what you’re willing to risk.
Mastering Time and Volatility with Theta and Vega
While Delta and Gamma are all about price movement, the next two Greeks—Theta and Vega—are where the real magic happens for income investors. These two forces govern time and market fear, which are the very elements an options seller learns to harness. If your goal is to generate consistent cash flow, getting to know this duo isn't just helpful; it's essential.
This powerful combination is what makes selling options a viable income strategy. You sell an option when its price is puffed up by high volatility (thanks to Vega), and then you profit as its value steadily bleeds out day after day (thanks to Theta).
Theta: The Inevitable March of Time
Think of Theta as the "rent" you collect for selling an options contract. It measures how much value an option loses each day simply because time is passing. For an option buyer, Theta is the enemy. For a seller, it's your primary source of profit.
Every option contract has a ticking clock—its expiration date. As that date gets closer, the contract's time value decays, and Theta is what quantifies this daily decay.
A Theta of -0.05 means the option you sold is losing roughly $5.00 in value each day (-0.05 x 100 shares), assuming everything else stays the same. For you, the seller, that’s a predictable, daily gain.
This decay isn’t a straight line. It actually accelerates as expiration approaches, especially in the last 30 to 45 days. This is exactly why many income sellers prefer shorter-dated options—to get the biggest bang for their buck from this accelerated decay. To really dig into this, our guide on how option time decay works breaks down how to use it strategically.
Theta in Action for Income Sellers
The goal is always to have time working for you, not against you. Here’s how Theta drives profit in common income strategies:
- Selling a Covered Call: You sell a call against stock you already own. Every single day that passes, Theta is chipping away at that option's value, bringing you one step closer to keeping the entire premium as profit.
- Selling a Secured Put: You sell a put, hoping it expires worthless so you can pocket the cash. Theta is your best friend here, as its daily decay is the force pushing the contract's value toward zero.
By consistently selling options, you're essentially putting yourself in a position to "collect Theta." It's one of the most reliable forces in the market because time, unlike stock prices, only moves in one direction.
Vega: The Volatility Gauge
Now, let's turn to Vega, which measures an option's sensitivity to changes in implied volatility (IV). Think of IV as the market's "fear gauge"—its forecast of how much a stock's price is expected to swing in the near future.
When uncertainty spikes—maybe an earnings report is coming up, or a big news story breaks—implied volatility tends to shoot up. This makes option premiums more expensive because there's a greater perceived chance of a big price move.
Vega tells you exactly how much an option's price will change for every 1% change in implied volatility.
Example of Vega:
An option has a Vega of 0.10. If implied volatility jumps from 30% to 31%, that option's price will increase by about $10 (0.10 x 100 shares). If IV falls by 1%, the option gets $10 cheaper.
The Core Strategy: Selling High Volatility
For an options seller, Vega lays out a clear and powerful game plan:
- Sell options when implied volatility is high. This lets you collect a fat, inflated premium. You're getting paid more for taking on the same amount of risk.
- Wait for volatility to return to normal. After the event passes (like an earnings report), the uncertainty disappears, and IV often drops sharply. This is often called a "volatility crush."
- Profit from the drop. As IV falls, Vega works in your favor, causing the value of the option you sold to shrink. This lets you buy it back for cheap or just let it expire worthless, keeping the difference.
To get a better feel for the statistics behind these price movements, a frequency distribution calculator can be a handy tool for analyzing historical data. It helps you visualize how often certain price swings happen, giving you real context for volatility metrics.
By pairing the strategy of selling high IV with the relentless, predictable decay of Theta, income investors create a powerful one-two punch for generating returns. You get paid upfront for taking on risk when the market is fearful, and then time itself does the heavy lifting to push the trade toward profitability.
Putting the Greeks to Work in Real Trades
Theory is great, but seeing how the Greeks operate in the wild is where the real learning happens. Let’s walk through two of the most common income strategies—selling a covered call and selling a secured put—and see how these numbers guide every decision.
By breaking down the full Greek profile for each trade, you'll see exactly how they tell the story of your position's risk and potential.

These aren't just abstract examples. They’re mini case studies designed to make concepts like Delta, Theta, and Vega feel tangible and, most importantly, actionable. We won't just cover the "what" of each trade; we'll get into the critical "why" behind the strategy.
Case Study 1: The Covered Call
Let's say you own 100 shares of stock ABC, which is trading at $100 per share. You want to squeeze some extra income out of those shares, so you decide to sell a covered call. The goal here is simple: have the option expire worthless so you can pocket the entire premium.
You pull up the options chain for contracts expiring in 45 days and pick a strike price that feels comfortable.
The Trade:
- Action: Sell 1 ABC Call Option
- Strike Price: $110
- Expiration: 45 Days
- Premium Collected: $2.00 per share (a nice $200 in your account)
Now, let's dissect the Greek profile the moment you place that trade.
Key Insight: Think of the initial Greek values as your trade's DNA. They establish a baseline for risk and tell you what to expect if the market behaves as you anticipate.
Initial Greek Profile:
- Delta: -0.25: Since you sold the call, your position Delta is negative. For every $1 the stock climbs, your short call's value increases by about $25, which works against you. But more importantly for an income seller, this 0.25 Delta is a rough proxy for probability. It suggests about a 25% chance of the stock closing above $110 at expiration. That means you have a 75% chance of success—a pretty comfortable spot to be in.
- Theta: 0.04: You're the seller, so your Theta is positive. This means your position is earning approximately $4.00 per day from time decay, all else being equal. This is the engine driving your profit.
- Vega: -0.12: Your position has negative Vega. If implied volatility (IV) jumps by 1%, the option's price will rise by about $12—a loss for you as the seller. This pinpoints your biggest risk: a sudden spike in market fear can make your short call more expensive to buy back.
What Happens When the Market Moves?
So, how does this position react when things change?
- Stock Rises to $105: Your Delta might creep up from -0.25 to -0.40. The probability of assignment has gone up, but you’re still profitable overall. Your trusty Theta keeps chipping away each day, helping to offset the paper loss from the stock's move.
- Stock Plummets to $95: The call is now far out-of-the-money. Your Delta might collapse to -0.10. The odds of the option expiring worthless are now extremely high (think 90%), and you're well on your way to keeping the full $200 premium.
- Volatility Spikes: An unexpected news event sends IV soaring by 5%. With your negative Vega of -0.12, the option's value balloons by roughly $60 (-0.12 x 5 x 100). This creates an instant unrealized loss, even if the stock price hasn't budged. It's a perfect illustration of why selling options into low volatility can be a risky game.
Case Study 2: The Secured Put
Now for the flip side. Let's say you have cash on the sidelines and want to buy 100 shares of stock XYZ, also trading at $100. But you’re a patient buyer and would rather get it at a discount. Selling a cash-secured put is the perfect tool for the job.
The Trade:
- Action: Sell 1 XYZ Put Option
- Strike Price: $90
- Expiration: 45 Days
- Premium Collected: $1.50 per share (or $150 total)
Initial Greek Profile:
- Delta: 0.20: The put option itself has a Delta of -0.20. But since you sold it, your position Delta is positive. This means you profit if the stock price goes up. That 0.20 Delta also tells you there's roughly a 20% chance of the stock dipping below $90 by expiration. In other words, you have an 80% chance of just keeping the premium.
- Theta: 0.03: With positive Theta, your position is quietly earning about $3.00 per day from the passage of time. Each day, that "income" makes the trade cheaper to close out.
- Vega: -0.10: Just like the covered call, you have negative Vega. A sudden rise in implied volatility will hurt your position by making the put you sold more expensive.
Comparing Greek Profiles for a Covered Call vs Secured Put
This table breaks down how the Greeks typically look for our two sample trades, giving you a clear side-by-side comparison of how each strategy is positioned.
| Greek Metric | Covered Call Example (Sell $110c on $100 stock) | Secured Put Example (Sell $90p on $100 stock) | What It Means for the Seller |
|---|---|---|---|
| Delta | -0.25 | +0.20 | The covered call seller is bearish on the option but still benefits if the underlying stock rises (up to the strike). The secured put seller is bullish, profiting if the stock price rises or stays flat. Both low Deltas signal a high probability of the option expiring worthless. |
| Theta | +0.04 ($4/day) | +0.03 ($3/day) | Positive Theta is the seller's best friend. Time decay works in your favor for both strategies, consistently eroding the option's value and bringing you closer to maximum profit. |
| Vega | -0.12 | -0.10 | Both sellers are short volatility. A spike in implied volatility (market fear) will increase the option's price, creating an unrealized loss. This is a key risk to monitor for any premium-selling strategy. |
By looking at these scenarios, the abstract numbers of the Greeks transform into practical, decision-making tools. They help you pick trades that match your goals—like a high probability of success (low Delta) and a steady "rental income" (positive Theta)—while keeping you laser-focused on the primary risks, like a sudden volatility spike (negative Vega).
How Modern Tools Simplify Greek Options Trading
While it’s crucial to have a solid grasp of the Greeks, you definitely don’t need to be a mathematician to use them. The days of plugging numbers into a clunky spreadsheet are long gone. Today’s trading platforms do all the heavy lifting for you, turning complex calculations into simple, actionable insights.
Modern tools automate this entire process. They pull in real-time market data and translate the sophisticated outputs of pricing models into clear, intuitive metrics. This has made data-driven greek options trading accessible to everyone, not just the quants on Wall Street.
For options sellers, this means you can instantly see the risk-reward tradeoff for any potential trade without getting bogged down in the formulas.
Turning Data into Decisions
Platforms like Strike Price were built specifically to simplify this for covered call and secured put sellers. Instead of just showing you a raw Delta number and leaving you to figure it out, these tools interpret it for you, presenting it as a clear probability of success.
So when you look at an options chain, you can immediately see the likelihood that each strike price will expire out-of-the-money. This lets you balance your hunger for higher premium income with your own personal safety threshold.
Technology’s greatest contribution to options trading is turning abstract Greek metrics into simple alerts and probabilities. It answers the most important question for an income seller: "What are my chances of winning this trade?"
This focus on probability empowers you to build a strategy based on data, not just a gut feeling. You can systematically pick trades that align with your risk tolerance, whether you’re aiming for a conservative 85% chance of success or a more aggressive 70%.
Smart Alerts and Proactive Risk Management
The real power of modern trading tools, though, is how they watch your back after you’ve placed a trade. The Greeks aren't static; they shift constantly with every tick of the market. A position that looked perfectly safe yesterday could become risky today.
Smart platforms use the Greeks to power proactive alerts that warn you when a position's risk profile is changing.
- Delta Spike Alerts: If the underlying stock moves against you, the Delta of your short option will climb. A tool like Strike Price can notify you when Delta crosses a threshold you've set, signaling that your probability of getting assigned has jumped.
- Volatility Warnings: If implied volatility suddenly spikes, your position's Vega will cause an unrealized loss. A timely alert gives you a heads-up, allowing you to manage the position before it spirals into a real problem.
This automated monitoring system acts as your personal risk manager, keeping an eye on things so you don't have to be glued to your screen all day. This level of analysis is powered by a massive data infrastructure once reserved for big institutions. In fact, the derivatives market's reliance on standardized Greek calculations has spawned a multi-billion-dollar industry supporting traders, with major exchanges and data providers like OptionMetrics providing real-time analytics across millions of contracts every single day.
Common Questions About Options Greeks
Once you start digging into options, a few key questions always come up. It's natural. Moving from just looking at a stock's price to understanding how Delta, Theta, and Vega are quietly shaping your trades can feel like a big leap.
Let’s tackle some of the most common questions traders have when they first start using these powerful metrics. The goal here is to give you clear, straightforward answers you can put to work immediately.
Which Greek Is Most Important for an Income Seller?
For anyone focused on selling covered calls and secured puts for income, it really boils down to two: Theta and Delta.
If you had to put one on top, it’s Theta. Think of Theta as the engine driving your entire income strategy. It’s the daily decay that erodes the value of the option you sold. As a seller, you're on the right side of this equation—every single day, Theta is working for you, pulling the trade toward a profitable close.
But Delta is a very close second, and it's your best friend for managing risk. It's a quick, data-driven way to gauge your probability of success before you even place the trade.
When you choose to sell an option with a low Delta, like 0.20, you are deliberately picking a trade that has roughly an 80% chance of expiring worthless. This simple check turns what feels like a guess into a calculated, repeatable process.
So, what's the verdict? Theta is where your profit comes from, but Delta tells you how likely you are to keep it. A solid income strategy needs both.
How Often Should I Check the Greeks?
There’s no magic number here—it really depends on your strategy and, most importantly, how much time is left until the option expires. But we can break it down into some practical guidelines.
- For positions 45+ days from expiration: A quick glance once a day or even every few days is usually fine. Far out from expiration, the Greeks tend to move at a snail's pace. Your position won’t be super sensitive to small, everyday market noise.
- For positions within 30 days of expiration: Now it's time to pay closer attention. Checking in daily is a good habit. Gamma risk—the rate of change in Delta—starts to wake up, meaning a sharp move in the stock can change your odds more quickly.
- During the final week of expiration: This is crunch time. Checking once or twice a day is smart. Gamma and Theta are at their most powerful, and even small price moves can have a massive impact on your profit and your risk of being assigned.
Of course, if the market is going wild or there’s big news about your stock, you’ll want to check your positions more often, no matter how much time is left.
Can I Trade Options Without Knowing the Greeks?
Sure, you can—but it's a bit like trying to sail across the ocean without a compass or a weather forecast. You might get lucky for a bit, but you're flying blind to the forces that are actually moving your position.
Without the Greeks, you’re just looking at price. You’re missing the powerful effects of time decay and volatility that are constantly at play. This leads to some classic mistakes:
- Selling options when volatility is rock bottom, which means you collect a tiny premium for taking on all the risk.
- Completely misjudging your odds of success, leading to one surprise assignment after another.
- Getting crushed by time decay working against you if you're buying options, watching your position bleed value every day.
Understanding the Greeks is what turns speculation into a real strategy. It allows you to measure your risk, find high-probability trades, and build a process you can repeat month after month. If you ignore them, you're pretty much leaving your success up to chance.
Ready to stop guessing and start making data-driven decisions? Strike Price translates complex Greek metrics into simple, actionable probabilities, so you can see your chances of success on every trade. Join thousands of traders earning consistent income. Discover your edge with Strike Price today!