How to Calculate Annualized Return: Simple & Quick Guide
If a stock moves past your strike, the option can be assigned — meaning you'll have to sell (in a call) or buy (in a put). Knowing the assignment probability ahead of time is key to managing risk.
Posted by
Related reading
A Step-by-Step Covered Calls Example for Consistent Income
Unlock consistent income with our step-by-step covered calls example. This guide breaks down the strategy, risks, and outcomes to help you trade confidently.
Long Call and Short Put The Ultimate Synthetic Stock Guide
Unlock the power of the long call and short put strategy. This guide explains how synthetic long stock works, its benefits, risks, and how to execute it.
What is a Call Spread? A Clear Guide to Bull and Bear Spreads
What is a call spread? Discover how bull and bear spreads limit risk and sharpen your options trading strategy.
Figuring out your investment's performance feels straightforward until you need to compare apples and oranges. An annualized return solves this by showing you the average yearly gain or loss on an investment, effectively leveling the playing field between assets you've held for different amounts of time.
It turns a jumble of timelines into one simple, standardized number.
Why Annualized Return Is Your Most Honest Metric

So many investors get hung up on the total return, but that number can be seriously misleading without context. A 20% gain sounds fantastic, right? But its real value is completely different if it took six months versus six years to get there.
This is the exact problem annualizing fixes. It converts that total return into an equivalent yearly rate, giving you a much clearer picture.
Think about it this way: one investment gives you 10% back in nine months, while another returns 13% over two years. Which one actually did better? At a glance, it's a toss-up. But when you annualize them, you might discover the first investment had a much stronger yearly performance rate.
Moving Beyond Simple Metrics
This isn't just a math exercise—it's about getting an honest look at how your portfolio is really doing. If you only look at the total return, you might end up making some bad calls. It's easy to hold onto a slow-growing asset for too long just because its cumulative gain looks impressive, all while missing out on other opportunities with better year-over-year momentum.
The whole point of annualizing a return is to take time out of the equation. It forces you to judge every investment on its own merits, no matter how long you've held it. That's absolutely critical for making smart decisions about where to put your money.
Getting comfortable with this metric is the first step toward evaluating your investments like a pro. It helps you:
- Compare Different Investments: Finally, you can accurately stack up a stock you've held for 18 months against a mutual fund you've owned for five years.
- Track Your Strategy: See if your investment picks are hitting your yearly growth targets, which is a huge part of learning how to set financial goals for the long haul.
- Identify True Performers: Uncover which of your assets are the real engines of growth in your portfolio, year in and year out.
Ultimately, using the annualized return gets you away from vanity numbers and helps you make genuinely informed decisions about where your money goes next.
The Simple Formula for Annualized Return
Ready to get into the weeds? Let's break down the actual math behind annualized return. It’s a lot less scary than it looks and is really just a way to find the smooth, average yearly growth rate of an investment.
Think of it this way: if your investment grew at a steady pace every single year, what would that percentage be? That's what this formula tells you.
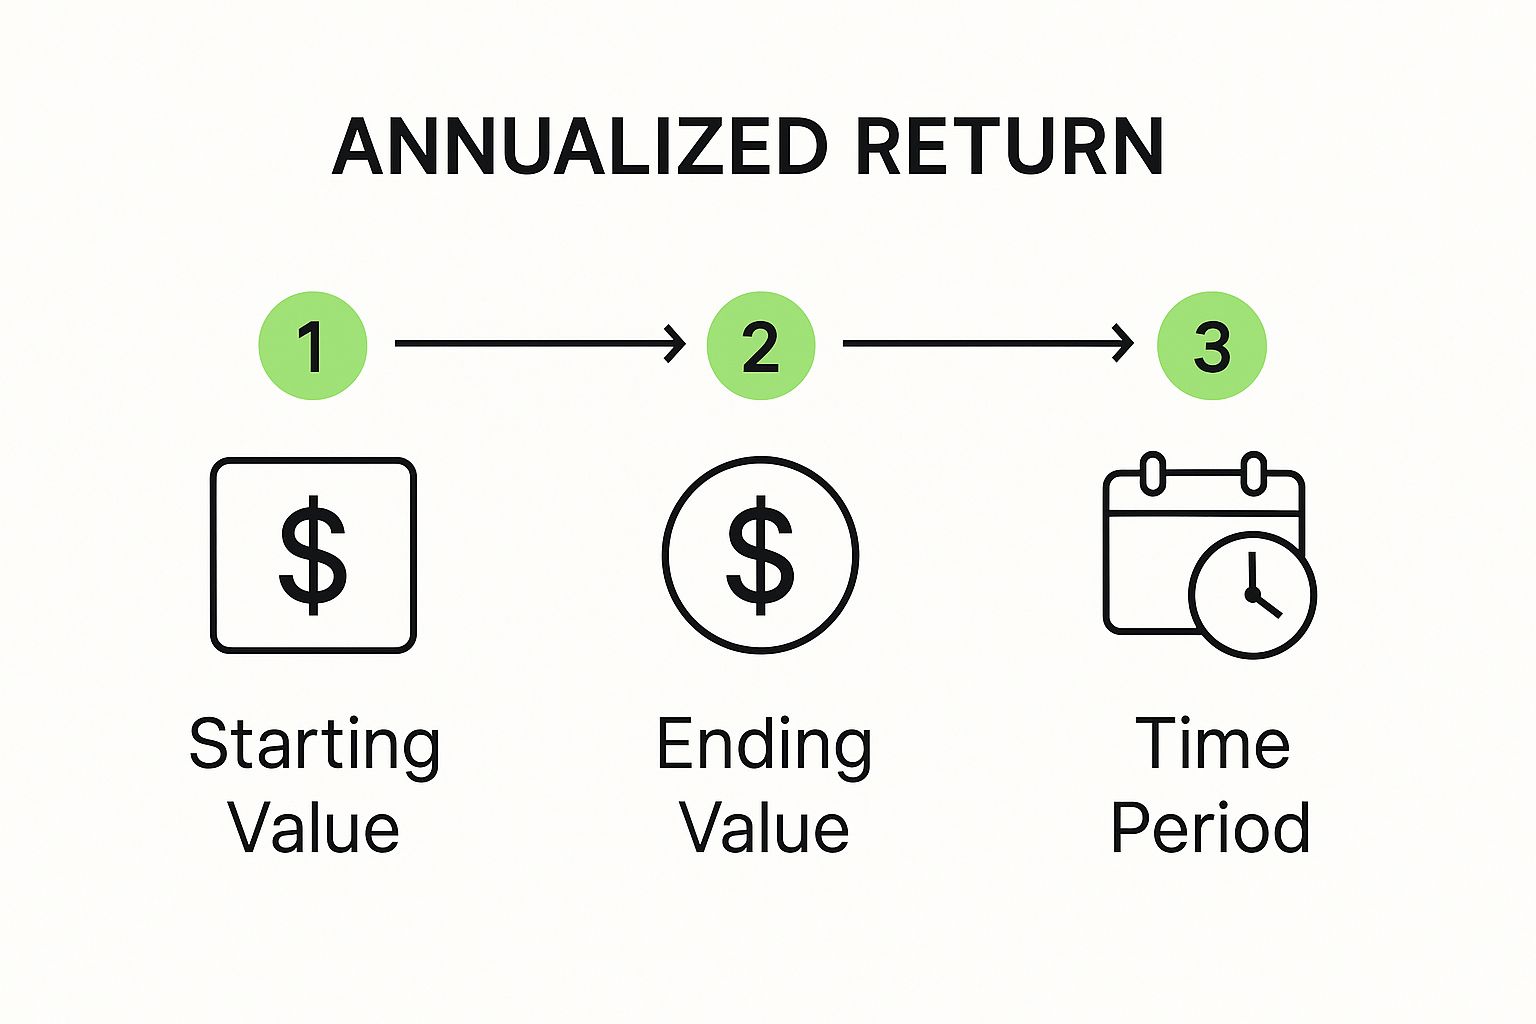
As the visual shows, you just need three pieces of information: what you started with, what you ended with, and how long you held the investment.
Breaking Down The Equation
The formula itself looks like this:
Annualized Return = ((Ending Value / Beginning Value)^(1 / N)) - 1
Here, ‘N’ is the key—it stands for the number of years you held the investment. This is what lets you compare apples to apples, putting a three-year investment on the same playing field as a ten-year one.
Before you jump into annualizing, it helps to have a solid grasp of how to calculate return on investment in general, since it's the foundation for almost every performance metric out there.
To help make sense of the formula, here's a quick breakdown of what each part means.
Formula Components Explained
| Component | Symbol | What It Means | Example Value |
|---|---|---|---|
| Beginning Value | N/A | The initial amount of money you invested. | $10,000 |
| Ending Value | N/A | The final value of your investment when you sold it. | $16,000 |
| Number of Years | N | The total time, in years, you held the investment. | 4 |
| Annualized Return | N/A | The final calculated average annual growth rate. | 12.47% |
This table gives you a clear snapshot of the inputs and the output, making the calculation much more approachable.
Let’s run through a quick, real-world scenario. Imagine you bought some tech stock for $10,000. You held onto it for exactly four years and then sold it all for $16,000.
Here’s how we’d plug those numbers in:
- Ending Value: $16,000
- Beginning Value: $10,000
- N (Years): 4
The calculation looks like this: (($16,000 / $10,000)^(1/4)) - 1
First, divide the end value by the start value: $16,000 / $10,000 = 1.6. Then, figure out the exponent: 1 / 4 = 0.25. This leaves you with (1.6^0.25) - 1.
The final number is 0.1247, which translates to an annualized return of 12.47%.
This means your $10,000 investment grew at an average rate of 12.47% each year for four years. It effectively smooths out all the market’s bumps and dips to give you one clean, comparable number.
The logic holds no matter the numbers. If a $2,000 portfolio grew to $5,000 over five years, its total return is a whopping 150%. But its annualized return is a more realistic 20% per year—a much clearer picture of its actual performance.
Once you’re comfortable with this math, you can start applying it to historical data to test your own ideas. A great next step is learning how to backtest a trading strategy to see if your approach holds up before you risk a single dollar.
Handling Returns for Less Than a Year
Not every investment is a long-term play. Sometimes you jump on a stock, ride a wave of good news, and cash out after just a few months. So, what do you do when you sell a winning stock after just 90 days?
Your brokerage account will show a simple gain, which is great, but it doesn't tell the whole story. To truly understand that trade's performance and compare it apples-to-apples with your other investments, you need to annualize it.
The Formula for Short-Term Holds
The logic is the same, but the formula needs a slight tweak. Instead of working with years, we're going to use the number of days you held the asset. This small adjustment is key to projecting a short-term gain over a full 12-month period.
Here’s the equation you'll need:
Annualized Return = ((Ending Value / Beginning Value)^(365 / N)) - 1
In this version, ‘N’ is simply the number of days you held the investment. By dividing 365 by N, you create an exponent that scales your short-term return up to what it would have been over an entire year.
Let’s run through a quick example. Imagine you bought $5,000 worth of a promising tech stock. Following a blowout earnings report, you decide to sell it exactly 90 days later for $5,300. Your simple return is a solid 6%. Not bad at all.
But what's the annualized return? Let's plug it in:
- First, divide the ending value by the beginning value:
$5,300 / $5,000 = 1.06 - Next, calculate the exponent:
365 / 90 = 4.055 - Apply that exponent to your initial result:
1.06 ^ 4.055 = 1.268 - Finally, subtract 1 to get the percentage:
1.268 - 1 = 0.268
Your annualized return is 26.8%. That’s a powerful number. It shows the yearly growth rate your money would hit if you could replicate that same 90-day performance over and over again.
This technique is especially useful for comparing your quick trades against annual benchmarks like the S&P 500. Annualizing accounts for compounding effects, making it an essential tool for evaluating everything from stock flips to short-term bonds. For a deeper dive, this video from YouTube breaks down how to compare different investment timelines.
Why This Matters for Your Strategy
Calculating the annualized return for short-term holds keeps you from underestimating the impact of your quicker, more profitable trades. A 6% gain in three months is a completely different beast than a 6% gain over a full year—and annualizing is the only way to properly measure that difference.
It gives you a clearer, more complete picture of your strategy's true effectiveness.
Are Your Returns Actually Any Good? Let's Benchmark Them.
So you've calculated your annualized return. Fantastic. But what does that number really tell you?
An 8% annualized return feels great on its own, but what if the broader market jumped 15% over that same stretch? Suddenly, your solid gain looks like a missed opportunity. This is exactly why benchmarking is so critical—it gives you the context to see if you're actually winning the race.
A return figure without a benchmark is just a number. With a benchmark, it becomes a powerful insight into how well your strategy is really working. You can finally see if your investment picks are adding real value or if you were just riding a market-wide tide.
Choosing the Right Yardstick
For most people invested in U.S. stocks, the S&P 500 is the go-to benchmark. It tracks 500 of the biggest American companies and has historically delivered an average annualized return of around 10% to 11% over the long haul. That makes it a tough, but fair, standard to measure against.
But—and this is a big but—you have to pick the right yardstick for your assets. Comparing a bond fund to a tech-heavy index like the Nasdaq 100 is like comparing a marathon runner to a sprinter. The results will be skewed and ultimately useless.
Your benchmark should always mirror your portfolio's ingredients:
- U.S. Large-Cap Stocks: The S&P 500 is your best bet.
- International Stocks: Look at an index like the MSCI EAFE.
- Small-Cap Stocks: The Russell 2000 is the classic choice here.
- Bonds: An aggregate index, like the Bloomberg U.S. Aggregate Bond Index, is what you need.
Benchmarking is what turns you from a simple scorekeeper into a sharp analyst of your own portfolio. It's the difference between knowing how fast you're going and knowing if you're actually in the lead.
This kind of analysis helps you make smarter decisions. For federal employees, this fits directly into broader financial strategy; you can find great resources for practical FERS retirement planning that show how performance checks like this are essential for long-term goals.
It also helps on a micro level. Knowing if a specific stock is outperforming its peers helps you figure out if it's a true gem or just another boat lifted by the tide. A huge piece of that puzzle is learning how to calculate intrinsic value to see if a company’s market price is actually backed by its fundamental strength.
Common Traps That Skew Your Calculation

Getting the math wrong on your annualized return can give you a dangerously flawed view of your investment's performance. It’s surprisingly easy to make a simple oversight that turns a mediocre result into something that looks amazing—or vice versa—leading you to make poor decisions based on bad data.
These mistakes are common, but they're also easy to avoid once you know what to look for. Building the discipline to produce numbers you can truly trust is a non-negotiable skill for any serious investor.
Overlooking Reinvested Dividends
One of the most frequent errors I see is forgetting to account for reinvested dividends. When a stock pays a dividend and you automatically reinvest it, you're essentially buying more shares, which increases the total value of your holding.
If you only look at your initial purchase price and final sale price, you’re missing a huge part of your total gain. It's a classic rookie mistake.
Always add the value of any reinvested dividends to your final ending value. This ensures your calculation reflects the total growth of the asset, not just its price appreciation. This is a crucial step to calculate annualized return accurately.
Miscalculating Your Holding Period
Another common slip-up is getting sloppy with the holding period. Using "about three years" instead of the exact number of days can significantly warp your final percentage. The formula needs precision to work its magic.
The fix is simple: count the exact number of days between your purchase and sale dates. Then, divide that number by 365 to get the correct 'N' value for your formula. This small step makes a big difference in accuracy.
Ignoring Fees and Taxes
This is the big one. The single biggest trap is ignoring the real-world costs of investing. Brokerage fees, commissions, and capital gains taxes all eat into your profits. Calculating a return before these costs shows you a number you never actually get to keep.
To get the truest picture of your performance, you have to use your net figures. Here’s how:
- Beginning Value: Your initial investment plus any commissions you paid to buy.
- Ending Value: Your sale proceeds minus any selling commissions and estimated taxes.
This approach shows you the real return—the money that actually lands in your pocket.
Common Questions
When you start digging into investment returns, a few common questions always pop up. Let's tackle the ones that tend to trip investors up the most when they're calculating annualized returns.
What's the Difference Between Annualized Return and CAGR?
Honestly, for most practical purposes, there isn't one. The terms are often used interchangeably because they're calculated with the exact same formula.
Both Compound Annual Growth Rate (CAGR) and annualized return are designed to show you the average yearly growth of an investment held for more than one year, assuming you reinvested all your profits along the way. Think of CAGR as just a more formal, specific name for the same idea: a smoothed-out rate of return over time.
Should I Bother Including Fees and Taxes?
For the most accurate picture of how your investment actually performed for you? Absolutely. It’s the only way to know what you really made.
A "gross" return (before costs) is fine for comparing how a fund manager did against an index, but your "net" return is what hits your bank account.
The only return that truly matters is the money you get to keep after everyone takes their cut. Always use your net cost as the starting value and your net proceeds as the ending value. That's your real-world result.
Can Annualized Return Be Negative?
It sure can. If your investment lost money over the time you held it, your total return is negative, and that will give you a negative annualized return when you run the numbers.
A negative figure simply shows you the average annual rate at which your investment’s value went down. Calculating this is just as important as calculating a positive one—it gives you a clear, quantifiable measure of an investment's real risk and potential downside.
Ready to turn guesswork into informed action? Strike Price provides real-time probability metrics to help you make smarter decisions on every trade. Stop gambling and start earning consistent income. Explore Strike Price today!