How to Calculate Risk Reward Ratio in Options Trading
If a stock moves past your strike, the option can be assigned — meaning you'll have to sell (in a call) or buy (in a put). Knowing the assignment probability ahead of time is key to managing risk.
Posted by
Related reading
Out of Money Call Options A Guide to Consistent Income
Learn how to use out of money call options to generate consistent income. This guide covers key strategies, risk management, and real-world examples.
How Options Are Priced A Practical Guide for Investors
Understand how options are priced with this clear guide. Learn about intrinsic value, implied volatility, and pricing models to improve your investing strategy.
Greek Options Explained for Income Traders
Unlock your options trading potential. This guide on greek options explained shows you how to use Delta, Gamma, and Theta to generate consistent income.
To figure out the risk/reward ratio, you just divide your potential profit by your potential risk. Let's say you stand to make a $200 profit on a trade but are only willing to risk a $100 loss—that's a risk/reward ratio of 2:1. This one number is the bedrock of disciplined trading.
Why Risk/Reward Is a Trader's Most Important Metric

It's time to stop guessing and start measuring. The risk/reward ratio isn't some fancy term for Wall Street pros; it's the simple framework that separates disciplined traders from gamblers. If you're an options seller focused on generating consistent income from covered calls and secured puts, getting this right is non-negotiable.
Think about it. You're looking at two different covered call opportunities. One has a juicy premium that immediately grabs your attention. But is it actually the better trade? The raw premium amount never tells the whole story.
Transforming Guesswork into Strategy
The risk/reward ratio forces you to define your potential loss before you ever click "buy" or "sell." It’s a straightforward comparison: what you stand to gain versus what you could lose. This gives you a clear, mathematical edge in every single decision you make.
When you calculate this ratio for every trade, you shift from a game of chance to a strategic business. It gives you a standard way to weigh different opportunities, so you're not just chasing high premiums without seeing the potential pitfalls. It’s about making informed decisions by putting a number on both the upside and the downside.
A risk-benefit analysis scrutinizes not only negative consequences but also potential positive ones. Establishing decision criteria requires a realistic appraisal of the benefits of a successful outcome as well as the costs if the decision doesn’t work out.
Building a Foundation for Consistency
Making the risk/reward ratio a core part of your strategy is fundamental to long-term success. The goal isn't to win every single trade—nobody does. The real goal is to make sure your winning trades are big enough to more than cover your losing ones over time.
For an income-focused options seller, this means:
- Clarity: You know your exact exit points—for both profit and loss—before you even place the trade. No more agonizing over what to do when a trade moves.
- Discipline: It takes emotion out of the driver's seat. This framework stops you from holding onto a losing trade for too long or closing a winner too early out of fear.
- Sustainability: It helps you build a profitable system where the math is always working in your favor over dozens or even hundreds of trades.
This mindset shift is everything. Without a clear handle on how to calculate risk/reward ratio, you're essentially flying blind. You’re letting the market's daily whims dictate your profitability instead of following a well-defined plan. This metric is your #1 tool for navigating the markets with confidence.
The Core Formulas for Calculating Your Ratio
Let's get the math out of the way. Calculating the risk/reward ratio isn't as complicated as it sounds. At its core, it's just a simple way to see exactly what you stand to gain versus what you could lose on any given trade.
The calculation is straightforward: divide your maximum potential profit by your maximum potential risk. The result gives you a clean, simple number you can use to compare any trade, apples to apples.
For options sellers, the "reward" side is easy—it's almost always the premium you get paid when you sell the contract. Defining the "risk," however, takes a little more thought, as it's different for covered calls and secured puts.
Calculating the Ratio for a Covered Call
When you sell a covered call, you're starting with at least 100 shares of a stock you already own. Your reward is the premium you collect for selling that call. That's your best-case scenario.
The risk is what happens if the stock tanks. To figure this out, you first need your breakeven point, which is simply what you paid for the stock minus the premium you just collected.
Here’s how the formula breaks down:
- Potential Reward: The total cash premium you receive.
- Potential Risk: (Your stock purchase price per share - Premium per share) - Your stop-loss price.
Let's walk through it. Say you bought 100 shares of XYZ at $50 and sell a call for a $2.00 premium ($200 total). Your breakeven is now $48. If you decide ahead of time to cut your losses if the stock hits $45, your risk is $3.00 per share ($48 breakeven - $45 stop-loss), or $300 total.
Your ratio for this trade is $200 / $300, or 1:1.5. You're risking $1.50 to make $1.00.
Calculating the Ratio for a Secured Put
With a cash-secured put, the reward is also the premium you collect. The risk is your obligation to buy the stock at the strike price if it drops, though the premium you collected helps cushion that blow.
Your breakeven here is the strike price minus the premium you received.
- Potential Reward: The total cash premium from selling the put.
- Potential Risk: (Strike Price - Premium per share) - Your stop-loss price.
Imagine you sell a put on XYZ with a $45 strike price and collect a $1.50 premium ($150 total). Your breakeven is $43.50. If your trading plan says to exit if the stock hits $42, your risk is $1.50 per share ($43.50 - $42), or $150 total.
In this case, the ratio is $150 / $150, a clean 1:1.
To make this even simpler, here's a quick reference table breaking down the components for both strategies.
Risk Reward Ratio At a Glance for Options Sellers
| Strategy | How to Define Potential Reward | How to Define Potential Risk | Simplified Formula |
|---|---|---|---|
| Covered Call | Total premium received from selling the call option. | The distance from your breakeven price down to your stop-loss price. | Premium / (Breakeven - Stop-Loss) |
| Secured Put | Total premium received from selling the put option. | The distance from your breakeven price down to your stop-loss price. | Premium / (Breakeven - Stop-Loss) |
This table shows that while the inputs are different (stock purchase price vs. strike price), the fundamental logic for calculating risk as an options seller is the same. It all comes down to how much you stand to lose between your breakeven point and your predetermined exit.
A consistent ratio is the foundation of a sustainable strategy. Traders using a classic 1:2 ratio—risking $1 to make $2—have shown remarkable resilience over time. In volatile markets, options sellers who consistently targeted 1:2 ratios on secured puts saw average annual returns of 15-20% on their portfolios, a testament to the power of disciplined risk management. Discover more insights about risk reward resilience and its long-term impact on Alchemy Markets.
Moving Beyond Ratios with Probability Analysis
A raw risk/reward ratio is a great starting point, but it only tells you half the story. It shows you the what—what you stand to gain versus what you could lose—but it completely ignores the how likely it is to happen. This is where experienced traders find their edge, moving from simple arithmetic to a much more powerful way of thinking.
Think about it this way: a trade with a fantastic 1:5 ratio sounds like a home run. Risking $100 to make $500? Sign me up. But what if that trade only has a 10% chance of actually working out?
If you made that trade ten times, you'd probably win once for a $500 gain, but you’d lose the other nine times, costing you $900. The net result? You're down $400. Suddenly, that "great" ratio doesn't look so hot.
This brings us to the metric that really matters: expectancy. Expectancy is just your risk/reward ratio weighted by its probability of success. It’s the key to understanding why a modest 1:2 ratio with a 70% chance of winning is a far better bet than a high-reward, low-probability gamble. The real goal isn't to chase the biggest ratio; it’s to consistently find trades with a positive expectancy.
Introducing Probability into Your Calculations
This is where modern trading tools become so valuable. They give you crucial probability data, like the chance an option will expire worthless. This lets you select strike prices based on a real, statistical balance of risk, reward, and likelihood.
Instead of just grabbing the strike that offers the juiciest premium, you can pick one with a quantifiable probability of success that actually fits your comfort zone. We dive deeper into how these metrics work in our guide on the options probability of profit.
You're always balancing the potential reward (the premium you collect) against the potential risk (the stock moving against you).
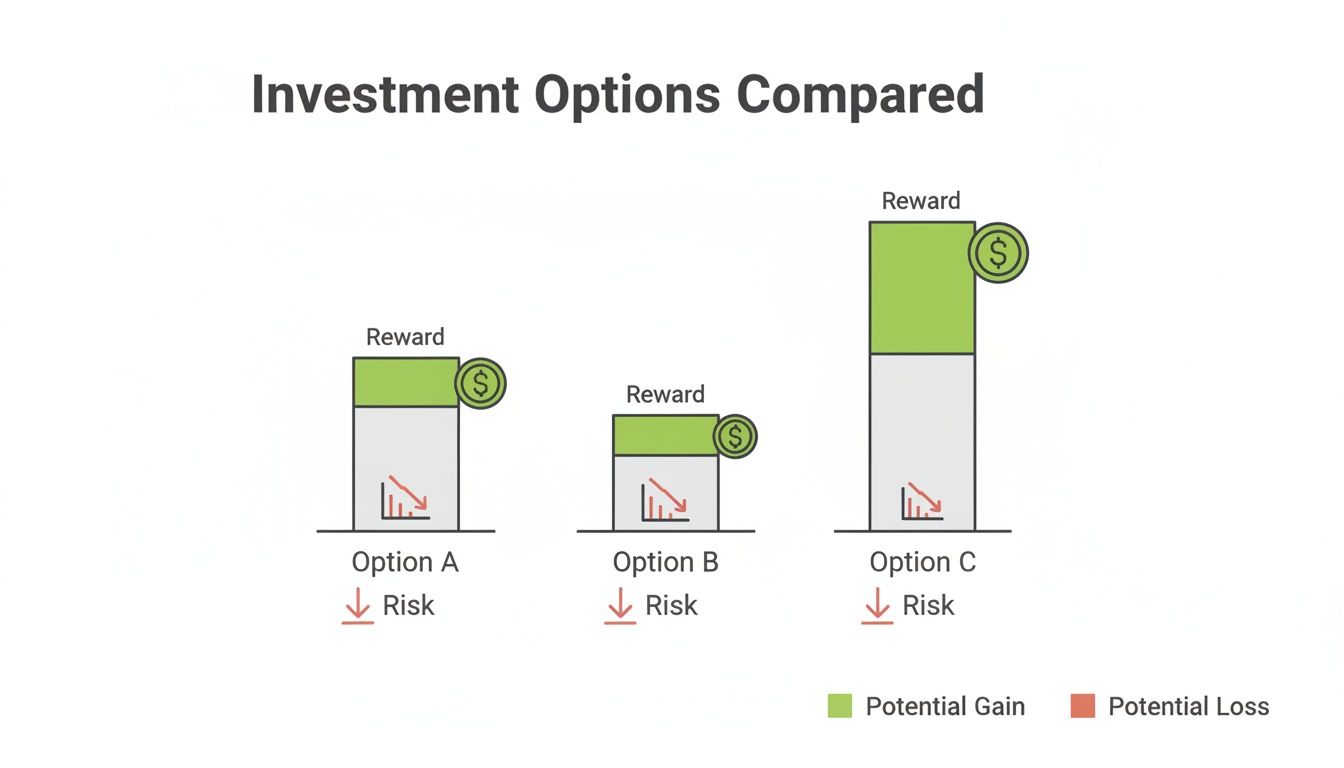
This constant tug-of-war is at the heart of every options trade.
Calculating for expectancy isn't complicated, but it fundamentally shifts your perspective. The formula evolves beyond simple division. A more accurate model for long-term profitability looks something like this:
True R/R Expectancy = (Average Profit x Win Percentage) / (Average Loss x Loss Percentage)
This formula gives you the true expected return on every single dollar you put at risk, because it accounts for both your wins and your losses over time.
Why a Lower Ratio Can Be a Winning Strategy
This probability-weighted approach explains why some of the most consistent strategies have seemingly unimpressive ratios.
Take a 1:0.5 ratio, for instance. Risking $200 to make $100 looks pretty terrible on paper. But what if that trade has an 80% win rate? Now the math works out beautifully.
Over ten trades, you’d expect:
- Eight wins, for an $800 profit.
- Two losses, for a $400 loss.
Your net result is a $400 profit. The high win rate more than made up for the "bad" ratio.
For traders looking to get even more advanced, a powerful tool for exploring potential outcomes is the Monte Carlo simulation. By bringing probability into your analysis, you stop being a speculator and start acting like an analyst. You’re making decisions based on statistical advantages, not just gut feelings—and that’s the cornerstone of any consistent income strategy.
Putting the Risk/Reward Ratio to Work in Real Trades
Theory is great, but the real test is applying these concepts to live trades. Let's walk through the numbers for a covered call and a cash-secured put to see how this plays out in the real world.
Seeing the math in action is the best way to get comfortable analyzing your own trades with the same sharp eye. We'll go beyond the basic ratio and bring in probability data to find a trade's true potential—the exact process that helps experienced traders make smarter, data-driven decisions instead of just chasing high premiums.
Covered Call Example: Microsoft (MSFT)
Let’s say you own 100 shares of Microsoft, which you originally bought for $420 per share. The stock has had a nice run and is now trading at $445. You decide it's a good time to sell a covered call to bring in a little extra income.
You pick a strike price of $460 that expires in 30 days and collect a $5.00 per share premium. That’s an instant $500 credit to your account. To protect your downside, you decide to set a stop-loss to get out of the entire position if MSFT drops to $405.
So, how does the math shake out?
- Maximum Reward: This one's easy. It’s the $500 premium you collected upfront.
- Breakeven Price: Your original cost for the stock minus the premium received: $420 - $5.00 = $415.
- Maximum Risk: This is the distance from your breakeven point down to your stop-loss: $415 - $405 = $10 per share, which comes out to a total risk of $1,000.
- Risk/Reward Ratio: Now we just divide the potential reward by the risk: $500 (Reward) / $1,000 (Risk) gives us a 1:2 ratio. You're risking $2 for every $1 you stand to gain.
On its own, a 1:2 ratio might not sound amazing. But this is where probability changes everything. Your trading platform shows the $460 strike has a 70% probability of expiring worthless. That high probability makes the 1:2 trade-off much more appealing, since the odds of you keeping the full $500 are heavily in your favor.
Cash-Secured Put Example: Apple (AAPL)
Now for a cash-secured put. You think Apple (AAPL) is a great company and you wouldn't mind owning it, especially if you could buy it at a discount from its current price of $175.
You decide to sell a put with a $165 strike price that expires in 45 days. For selling this contract, you collect a $4.00 per share premium, pocketing a total of $400. You also set a mental or actual stop-loss at $158, the price at which you’d close the trade to limit losses if AAPL really takes a nosedive.
Let's run the numbers:
- Maximum Reward: Again, it’s the premium you were paid: $400.
- Breakeven Price: The strike price minus the premium you collected: $165 - $4.00 = $161. This is your true cost basis if you get assigned.
- Maximum Risk: The difference between your breakeven and your stop-loss: $161 - $158 = $3 per share, or $300 total.
- Risk/Reward Ratio: $400 (Reward) / $300 (Risk) gives you a 1.33:1 ratio (or about 4:3). In this case, you stand to make $1.33 for every $1 you're risking.
A positive ratio like this is already a good start. But when you layer in the probability, the trade looks even better. The platform shows your $165 put has an 80% chance of expiring out-of-the-money. Combining a favorable ratio with a high probability of success is what separates guessing from a calculated trading strategy.
Thankfully, these calculations are much simpler than what’s needed when you learn what is an options spread, which involves juggling multiple option legs at once.
Finding a Good Risk Reward Ratio for Your Strategy
Once you nail down how to calculate the risk/reward ratio, the next question is always, "Okay, so what's a good one?"
There's no single magic number, but some rules of thumb have stuck around for a reason—they're just good math. Many traders will only take trades with a 1:2 or 1:3 ratio. That means they're aiming to make at least two or three times what they're willing to lose.
This simple rule builds a powerful buffer into your trading. It lets you be wrong more often than you're right and still come out ahead.
Your Ratio Has to Match Your Win Rate
The "right" ratio for you is completely tied to your personal win rate—the percentage of your trades that actually make money. A strategy that hunts for huge wins only works if those occasional home runs are big enough to cover all the smaller, more frequent losses.
Think about it this way:
- If you have a low-win-rate system (say, around 20-30%), you absolutely need a high risk/reward ratio of 1:3 or better just to stay in the game.
- But if your strategy is a consistent winner (70-80% of the time), you can be profitable with a more modest 1:1 or even a 1:1.5 ratio.
The core idea is simple: your ratio and win rate have to dance together. One without the other is a recipe for a slowly draining account. Your goal is to find a sustainable balance where the math consistently works in your favor over the long haul.
Understanding this relationship is what lets you tailor your trade selection to your personal style. It's less about chasing a perfect ratio and more about making sure the one you choose actually works with your real-world trading performance.
Breakeven Win Rates for Common Ratios
Let's make this tangible. Here’s the minimum win rate you need just to break even with different ratios. This table really puts the trade-off into focus.
| Risk Reward Ratio | Required Win Rate to Break Even |
|---|---|
| 1:0.5 (Risk $2 to make $1) | Must win more than 67% of the time. |
| 1:1 (Risk $1 to make $1) | Must win more than 50% of the time. |
| 1:2 (Risk $1 to make $2) | Must win more than 33% of the time. |
| 1:3 (Risk $1 to make $3) | Must win more than 25% of the time. |
See how that works? Demanding a higher reward for your risk dramatically lowers the pressure on your win rate.
This concept is a huge part of what professionals call a risk-adjusted return, where you always look at your gains in the context of the risk it took to get them. If you’re interested in diving deeper, you can explore our detailed guide on what is risk-adjusted return. This mindset empowers you to build a strategy that fits your personality, whether you're someone who prioritizes high-probability wins or high-payout trades.
Common Questions About Risk Reward
Once you start using the risk-reward ratio in your daily trading, a few questions always seem to pop up. Let's walk through them, because getting these answers straight will give you a lot more confidence when you're setting up your next covered call or secured put.
Think of the ratio less like a strict rule and more like a compass. It's there to help you navigate the market's twists and turns and guide you toward smarter, more consistent decisions.
How Does Market Volatility Affect My Risk Reward Ratio?
When volatility spikes, so do option premiums. That's just how it works. On paper, those juicy premiums make your potential reward look fantastic, which can make your risk-reward ratio seem better than ever.
But here’s the catch: that volatility is a double-edged sword. It also means the stock is more likely to make wild, unpredictable moves. This jacks up the real risk of the trade turning against you and getting assigned. In choppy markets like these, you should demand a better-than-usual ratio to make the extra risk worth your while. Always ask yourself if the bigger premium is truly enough to cover the higher chance of a bad outcome.
For options sellers, volatility is the price of opportunity. It boosts your potential income (the reward), but it also inflates the odds of an unfavorable outcome (the risk). Be sure to adjust your expectations—and your ratio requirements—to match.
Can I Adjust a Trade if the Ratio Becomes Unfavorable?
Absolutely. In fact, this is what separates seasoned options sellers from beginners. The second a stock makes a big move against you, that risk-reward ratio you calculated at the start is out the window. It's no longer relevant because your risk has shot up.
This is where skilled traders "roll" their positions. Rolling simply means closing your current option and opening a new one with a different strike price or a later expiration date. The goal is to collect more premium or improve your breakeven point, effectively hitting the reset button on the trade's risk-reward profile to make it favorable again.
Should I Ever Accept a Risk Reward Ratio Less Than 1-to-1?
Generally, no. Risking more than you stand to gain (a ratio below 1:1) is a tough way to make a living. It means you have to be right way more often than you're wrong, and that's a difficult game to win long-term.
There is one exception, though. Some very high-probability strategies, like selling far out-of-the-money options, are built this way. The trade-off is an extremely high win rate—often 90% or more. The entire strategy is based on the idea that lots of small, consistent wins will more than make up for the rare but larger loss. This approach demands strict risk management and is usually better for more advanced traders. For most of us building an income portfolio, targeting a ratio of 1:1.5 or better is a much healthier balance.
Ready to stop guessing and start making data-driven decisions? Strike Price provides real-time probability metrics for every strike price, helping you find the perfect balance between premium income and risk. Our smart alerts and consolidated dashboard turn complex analysis into simple, actionable insights. Start your free trial of Strike Price today and transform your options strategy.