What Is Option Chain: what is option chain — A Trader's Guide
If a stock moves past your strike, the option can be assigned — meaning you'll have to sell (in a call) or buy (in a put). Knowing the assignment probability ahead of time is key to managing risk.
Posted by
Related reading
Out of Money Call Options A Guide to Consistent Income
Learn how to use out of money call options to generate consistent income. This guide covers key strategies, risk management, and real-world examples.
How Options Are Priced A Practical Guide for Investors
Understand how options are priced with this clear guide. Learn about intrinsic value, implied volatility, and pricing models to improve your investing strategy.
Greek Options Explained for Income Traders
Unlock your options trading potential. This guide on greek options explained shows you how to use Delta, Gamma, and Theta to generate consistent income.
An option chain is a neat, organized list of all the available option contracts—both Calls and Puts—for a specific stock or ETF. Think of it as a comprehensive menu for traders, showing every possible trade for different expiration dates and strike prices. It's the central hub for analyzing market sentiment and finding your next trade.
What Is an Option Chain and Why It Matters to Traders

Ever stood in a grand airport terminal, staring up at the massive departure board? Each row is a different flight, showing its destination, departure time, and flight number. An option chain works in a very similar way, but it's for financial options instead of flights.
This digital "departure board" is your command center for understanding potential trades. It lays out every available option contract so you can see the entire landscape of possibilities at a glance. Instead of destinations and times, you’re looking at strike prices and expiration dates.
Your Command Center for Trading Decisions
The option chain is the primary tool traders use to gauge liquidity, evaluate pricing, and find opportunities. Its structure is designed for efficiency, usually splitting the view into two distinct sides:
- Call Options: Typically on the left, giving the buyer the right (but not the obligation) to buy the underlying stock at a set strike price.
- Put Options: Found on the right, giving the buyer the right to sell the underlying stock at the strike price.
This layout lets you quickly compare Calls and Puts side-by-side for the same strike price, making it an invaluable tool for strategy. For income-focused investors selling covered calls and secured puts, this is where the action is.
An option chain isn't just a list of prices; it's a map of market expectations. By learning to read it, you can see where other traders are placing their bets, assess potential risk, and identify contracts that align with your financial goals.
Before we dive into each column, here’s a quick overview of the most important components you'll encounter.
Key Components of an Option Chain at a Glance
| Component | What It Tells You | Why It's Important for Sellers |
|---|---|---|
| Strike Price | The price at which you agree to buy or sell the stock. | The foundation of your trade—determines profit and assignment risk. |
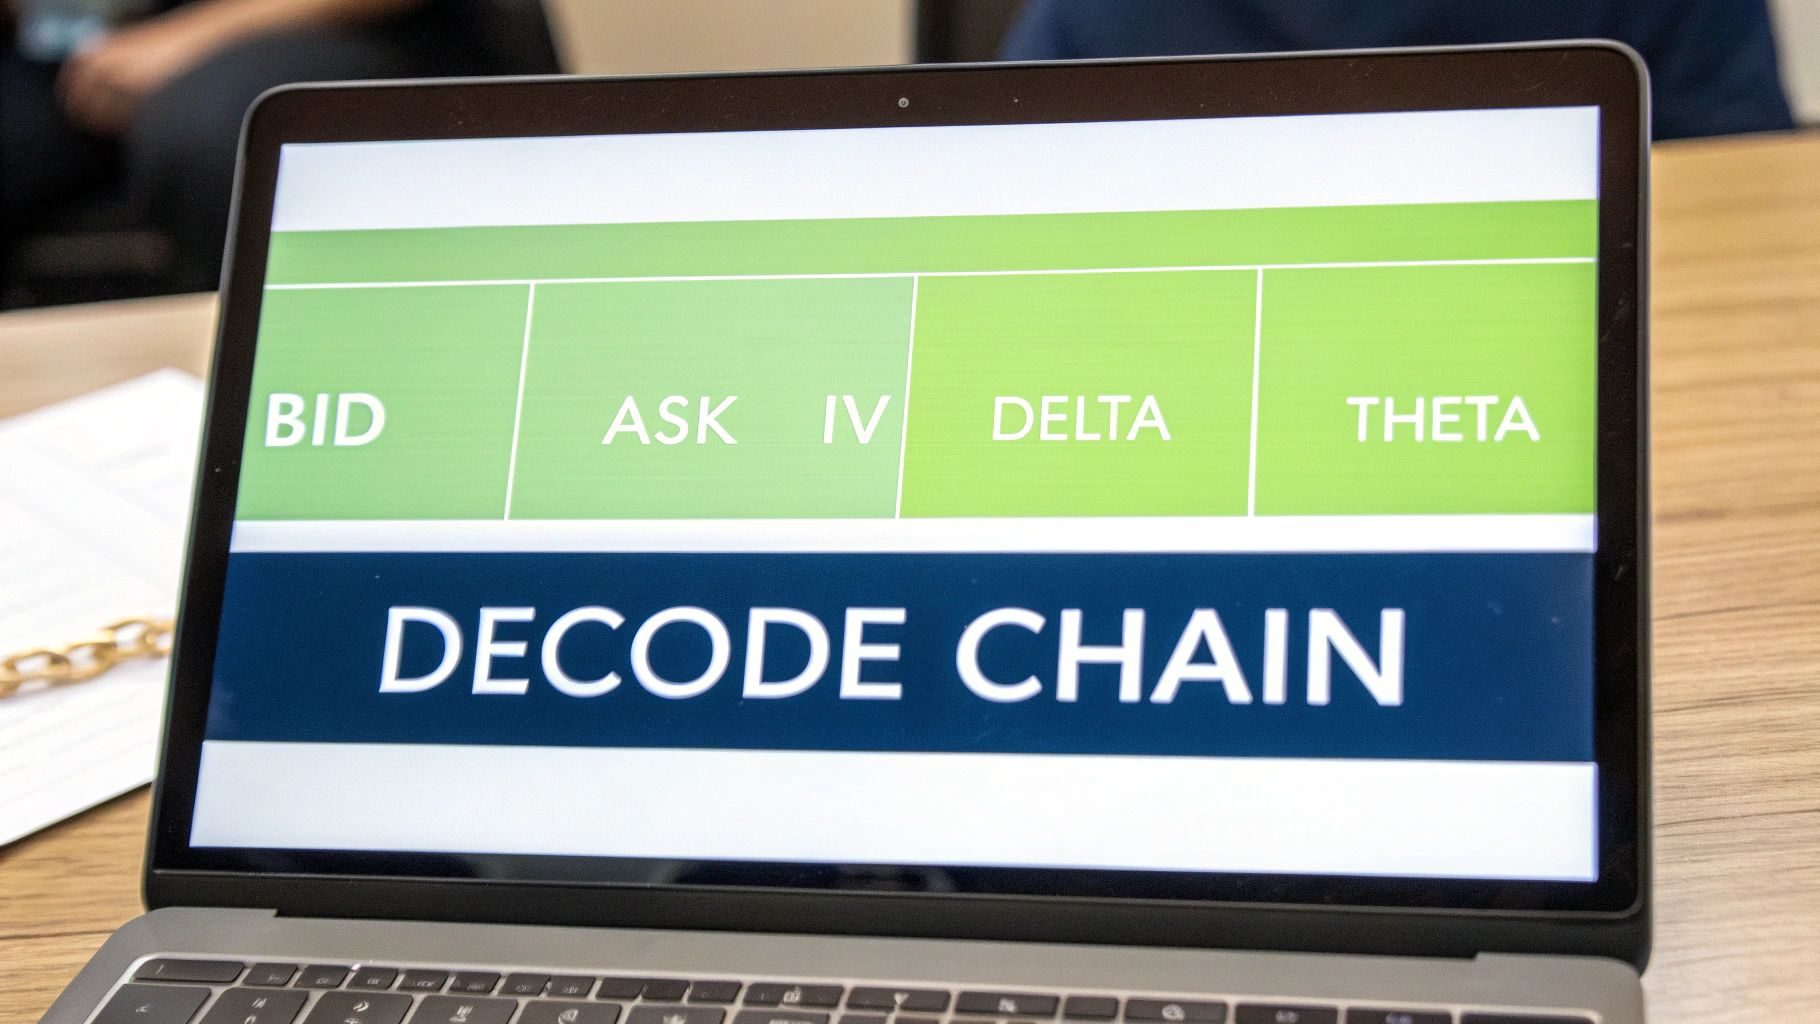
| Bid/Ask | The current market prices to sell (Bid) or buy (Ask) the contract. | The Bid price is what you'll receive as premium when you sell a contract. |
| Volume | How many contracts have traded today. | Shows current interest and activity, indicating liquidity for getting in/out. |
| Open Interest | The total number of contracts that are currently open. | High OI suggests a liquid and established market for that specific contract. |
| Expiry Date | The date when the option contract expires. | Defines the timeframe for your trade and when you'll know the outcome. |
This table gives you a bird's-eye view. Now, let's unpack what each of these—and several other key metrics—really means for your trading.
From Data Overload to Strategic Insight
At first glance, the dense grid of numbers can feel overwhelming. But each column provides a critical piece of the puzzle. When you understand them, the chain transforms from a confusing table into a powerful analytical tool.
The sheer volume of data is immense. Globally, comprehensive option-chain datasets now cover millions of symbols and strikes. Major US options feeds, for instance, list over 1.6 million symbols, publishing the consolidated data that builds the very chains we rely on. You can get a sense of how this extensive market data is structured on platforms like Databento.
This guide will demystify each component, showing you how to move from confusion to confidence. You’ll soon see the option chain not as a wall of data, but as your roadmap to making smarter, more informed trading decisions.
Decoding Each Column of the Option Chain
At first glance, an option chain looks like a wall of numbers. It can feel intimidating, but it’s really just a structured list of data points. Think of it less like a complex chart and more like a map of potential opportunities. Each column tells you a piece of the story, and learning to read them is the key to unlocking its power.
Most chains are split right down the middle. Call options, which give the owner the right to buy the stock, are typically on the left. Put options, the right to sell the stock, are on the right. The strike prices run down the center, acting as the common reference point for both sides.
The Foundational Columns: Strike Price and Expiration
Every single options contract is defined by two core elements: the strike price and the expiration date.
The strike price is the agreed-upon transaction price. If you sell a covered call with a $105 strike, you’re agreeing to sell your shares for $105 each if the option is exercised. Simple as that. It's the anchor for your entire trade.
The expiration date is the contract's deadline. Every option has a limited lifespan, and this date marks the last day it's active. For an option seller, this is the day you hope the contract expires worthless, letting you pocket the entire premium. You can usually select different expirations, from weekly contracts to monthly ones, and even long-term LEAPS.
- Strike Price: The price at which the stock can be bought (Call) or sold (Put).
- Expiration Date: The final day the contract is valid, dictating your trade’s timeframe.
Choosing the right combination of strike and expiry is the first real decision you make. It’s a constant balancing act between the premium you can collect and the risk you’re willing to take on.
Navigating the Price Columns: Bid, Ask, and Mid
Once you’ve zeroed in on a strike price, the next columns to look at are all about pricing. These numbers tell you what a contract is worth right now.
The Bid price is the highest amount a buyer is currently willing to pay. As a seller, this is the price you'd get if you sold the contract at market value that instant. The Ask price is the flip side—it’s the lowest price a seller is willing to accept.
That gap between the two is called the bid-ask spread. A narrow spread is a great sign; it means the option is liquid and actively traded. A wide spread, however, is a red flag. It means you could lose a chunk of your potential profit just by getting in and out of the trade. The Mid price is just the midpoint between the bid and ask, often used as a quick reference for fair value.
For option sellers, the Bid is your most important price. It represents the immediate premium you can collect. Always look for options with a tight bid-ask spread to ensure you're getting a fair price and can exit the trade easily if needed.
Understanding Implied Volatility: The Market's Fear Gauge
One of the most powerful—and often misunderstood—columns is Implied Volatility (IV). Think of IV as the market's collective guess about how much a stock's price will swing in the future. It’s shown as a percentage and basically acts as a "fear gauge."
When traders expect big moves, maybe from an upcoming earnings report or big news, they start bidding up option prices. This extra demand inflates the option's value, which in turn causes IV to rise. High IV means higher premiums, which is exactly what sellers love to see. But it's a double-edged sword: it also signals higher risk and the potential for sharp, unexpected stock movements.
Demystifying the Greeks
The "Greeks" sound complicated, but they're just a set of risk metrics that measure an option's sensitivity to different factors. For sellers, two are especially important.
- Delta: Think of Delta as the option's speedometer. It tells you roughly how much the option's price will change for every $1 move in the stock. A Delta of 0.30 means the premium will increase by about $0.30 if the stock price rises by $1. As a seller, you'll often prefer lower Delta options, as they're less sensitive to the stock’s daily wiggles.
- Theta: Theta is the melting ice cube. It measures how much value an option loses each day just from the passage of time. This is an option seller's best friend. As each day ticks by, the value of the option you sold decays, pushing you closer to keeping the full premium.
Once you get a feel for these columns, the option chain transforms from a confusing grid of numbers into a dynamic tool. It lets you analyze risk, spot fair prices, and pick the trades that perfectly match your strategy.
Using Volume and Open Interest to Find Liquid Options
Not all options are created equal. You could have two contracts with the exact same strike price and expiration date, but they might behave worlds apart when you try to trade them. The secret sauce that separates a smooth trade from a frustrating one is liquidity.
To measure it, we turn to two of the most important columns on any option chain: Volume and Open Interest.
Think of each option contract as its own little marketplace. For that market to work well, you need a healthy flow of buyers and sellers. Without them, you risk getting a terrible price on your trade—or worse, getting stuck in a position you can't get out of.
The Daily Chatter vs The Total Crowd
Volume and Open Interest are often mistaken for one another, but they tell two very different—and equally important—parts of the liquidity story.
Here’s a simple way to keep them straight:
- Volume is the "daily chatter." It shows how many contracts were traded today. It’s a real-time pulse check on what traders are interested in right now.
- Open Interest (OI) is the "total crowd size." This is the total number of contracts that are still open and haven't been settled. It's the cumulative number of positions carried over from previous days.
High volume tells you a particular strike is getting a lot of attention today. High open interest, however, signals that a large number of traders have established positions over time and are holding them, suggesting a deep and stable market for that contract.
For an options seller, the sweet spot is finding contracts with both high Volume and high Open Interest. This is the hallmark of a healthy, active market where you can get in and out of your position without a fuss. We dive even deeper into this in our guide on Open Interest vs Volume in options trading.
Volume vs Open Interest What's the Difference
To make it even clearer, here’s a quick breakdown of how these two metrics stack up and why they're so critical for anyone selling options.
| Metric | What It Measures | Analogy | Why It Matters for Sellers |
|---|---|---|---|
| Volume | Number of contracts traded today. Resets to zero each morning. | The day's attendance at a popular coffee shop. | Shows current, active interest. High volume helps confirm that today's price is relevant and there are people to trade with right now. |
| Open Interest | Total number of contracts that are still open and unsettled. | The total number of members who have a subscription to the coffee shop. | Indicates a deep, established market. High OI means there's a large pool of existing positions, making it easier to enter and exit trades fairly. |
Together, they paint a full picture of a contract's health. Volume shows you the immediate activity, while Open Interest reveals the long-term depth of the market. Aiming for contracts that are strong in both is a simple but powerful way to reduce risk.
Why Liquidity Is an Option Seller's Best Friend
So, why does all this matter? High liquidity translates directly into better trading conditions for you.
When lots of people are trading a contract, the competition between buyers and sellers naturally tightens the bid-ask spread—the gap between the highest price a buyer will pay (the Bid) and the lowest price a seller will accept (the Ask). This is a huge deal for sellers, as it means the price you get (the Bid) is much closer to the contract's real market value (the Mid).
A tight spread means you’re not giving away your profits just to open a trade. A spread of $0.01 is fantastic. But a wide spread of $0.25 means you're instantly down $25 per contract the moment you sell it.
Liquidity isn't just a "nice-to-have"—it's a core risk management tool. A liquid market gives you the freedom to close your position when you want, whether to lock in a profit or cut a loss, without getting crushed by a wide spread.
The Dangers of Illiquid Options
Trading options with low Volume and low Open Interest is a classic rookie mistake. It's easy to get drawn in by a juicy-looking premium, but the hidden costs can wipe out any potential gains.
Here’s what you’re up against with illiquid options:
- Wide Bid-Ask Spreads: That high Mid price you see on your screen isn't what you'll get. The Bid price could be drastically lower, taking a huge bite out of your premium from the start.
- Difficulty Exiting: Need to close your trade? Good luck. There might not be a buyer on the other side, forcing you to accept a lowball offer or, in a nightmare scenario, trapping you in the trade until it expires.
- Price Slippage: If you use a market order on an illiquid contract, the price you end up with can be far worse than the last price you saw quoted.
To dig a little deeper, you can also explore the definition of open interest to round out your understanding.
The bottom line is simple: always check the Volume and Open Interest before you even think about selling a contract. By focusing on liquid options, you make sure the market mechanics are working for you, not against you.
Finding Covered Call and Secured Put Opportunities
Okay, so you've got the lay of the land with the option chain. Now for the fun part: turning that wall of numbers into actual income trades. This is where theory hits the road, and you start spotting high-quality covered call or secured put opportunities that fit your game plan.
Let’s walk through how to use the chain to cherry-pick contracts that offer a sweet spot between premium income and risk you can live with.
Scanning for Covered Call Candidates
If you’re selling covered calls, your goal is simple. You want to generate income from stocks you already own by selling call options against them. The perfect trade? Collecting a decent premium on a contract that has a high chance of expiring worthless. That means we're hunting for out-of-the-money (OTM) strikes.
Here’s a quick-and-dirty process for finding them:
- Pick an Expiration Date: First, decide on your timeframe. Shorter-term expirations—think weekly or monthly—tend to offer better annualized returns because time decay (Theta) chews away at their value faster.
- Filter for OTM Strikes: Look at the call side of the chain. You’re looking for strike prices that are above where the stock is currently trading. These are your OTM contracts.
- Eyeball the Premium (Bid Price): Scan down the "Bid" column. This is the cash you'll get per share for selling. Ask yourself: is this premium worth the risk of having to sell my shares?
- Check for a Pulse (Liquidity): Before you pull the trigger, take a peek at the Volume and Open Interest for that strike. High numbers here are a good sign—it means you can get in and out of the trade easily without getting gouged by a wide bid-ask spread.
Follow these steps, and you can quickly sift through the noise and find a few solid candidates. For a deeper dive, check out our complete covered call strategy for income guide.
Identifying Secured Put Opportunities
Selling a secured put is a bit different. You're getting paid to agree to buy a stock you like, but only if it drops to a price you're happy with. The process is a mirror image of finding covered calls—you're just playing on the put side of the chain.
You're looking for an OTM put that pays a worthwhile premium, with a strike price where you'd genuinely be happy to become a shareholder.
At its core, selling secured puts is about getting paid for your patience. You're telling the market, "I'm willing to buy this stock I already like, but I want a discount." The option chain is how you find that perfect entry point.
Here’s how to spot these opportunities:
- Choose a Stock You Want to Own: This is rule number one. Don't ever sell a put on a company you wouldn't be thrilled to have in your portfolio long-term.
- Look for OTM Put Strikes: On the put side of the chain, scan for strike prices below the current stock price.
- Balance Premium and Probability: Check out the "Bid" price for these puts. The further you go out-of-the-money, the smaller the premium gets, but the better your odds of the option expiring worthless. Find a strike that pays you enough for the risk you’re taking on.
- Confirm Strong Liquidity: Just like with calls, this is non-negotiable. Make sure the contract has healthy Volume and Open Interest so you can get a fair price and manage the trade without any headaches.
The diagram below shows the simple, two-step check for confirming an option's liquidity.
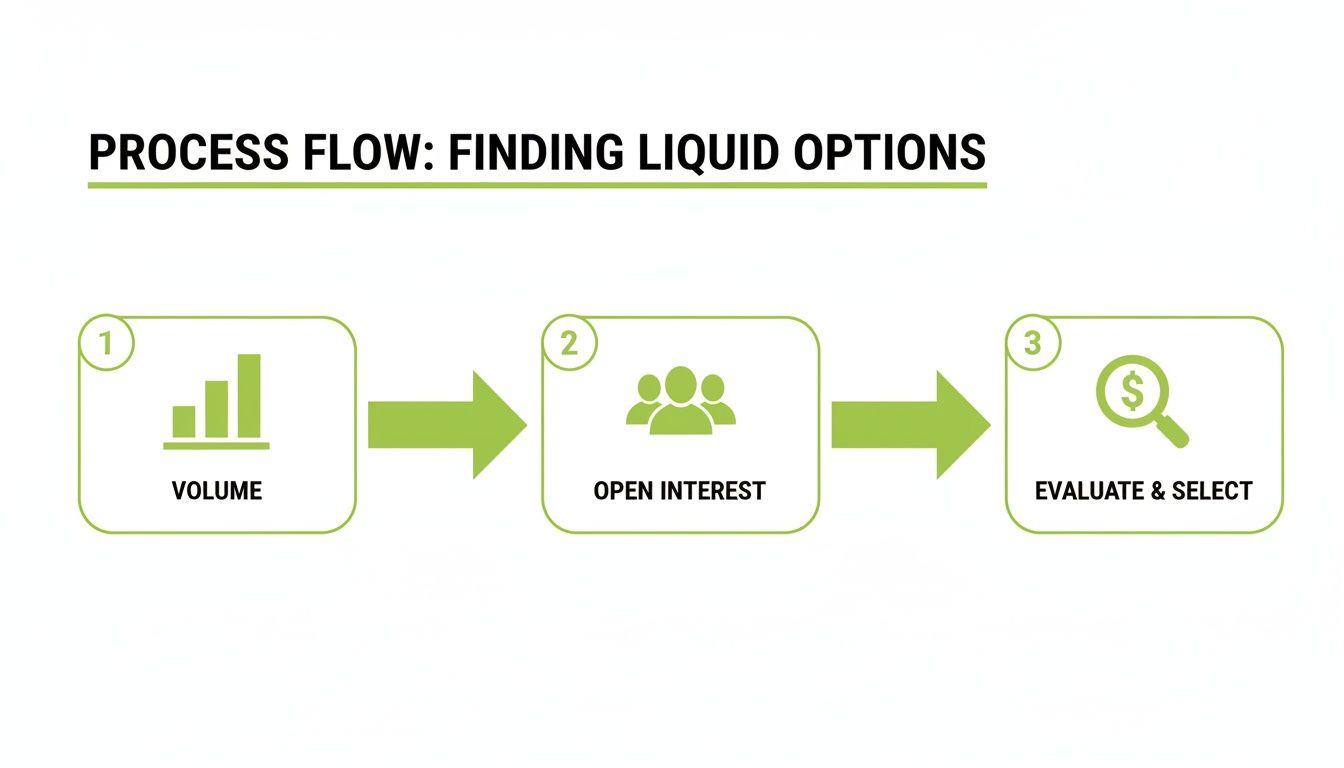
This is your go/no-go checkpoint. Always glance at both Volume and Open Interest before committing to any trade.
Bringing It All Together with Key Metrics
Once you've got the basics down, you can start layering in a few more data points from the chain to really sharpen your selections. These metrics give you a much clearer picture of the risk and reward you're looking at.
Delta as a Probability Gauge
Delta is more than just a Greek—it's a handy, back-of-the-napkin way to estimate the probability of an option finishing in-the-money. A call option with a Delta of 0.20, for instance, has roughly a 20% chance of expiring ITM.
As an option seller, that's your edge.
- For Covered Calls: Selling a call with a low Delta (say, under 0.30) means there’s a high probability (over 70%) that the stock will end up below your strike price. That lets you keep both the premium and your shares.
- For Secured Puts: A put with a Delta of -0.25 is telling you there's about a 25% chance of assignment. Flip that around, and you have a 75% chance of just pocketing the premium without having to buy the stock.
Implied Volatility (IV)
Always give the Implied Volatility (IV) column a look. High IV means juicier premiums, which is exactly what we want as sellers. But it's also a warning sign from the market that it's expecting big price swings, which ramps up your risk. A smart move is to compare a contract's IV to the stock's own history—is this premium actually inflated, or just business as usual?
By combining all these pieces—strike selection, premium, liquidity, and a little help from Delta and IV—you can methodically use the option chain to build a portfolio of high-probability income trades.
How Professionals Turn Data into Decisions
An option chain is much more than just a grid of prices. Think of it as a real-time snapshot of the market's collective brain. While the individual columns tell you what's happening right now, seasoned traders know how to read between the lines to figure out why—and what might happen next.
This is the secret sauce: option prices aren't random. They're a direct reflection of the market's forecast for a stock's future. Every single premium is a delicate balance of supply and demand, fear and greed. This raw data is what allows sophisticated platforms to perform a kind of financial alchemy.
From Prices to Probabilities
The real magic begins when you stop looking at prices and start seeing probabilities. By taking all those data points from the option chain—implied volatility, strike price, time left until expiration—you can calculate the odds of a stock finishing above or below a certain price by a certain date.
Suddenly, the option chain transforms from a static table into a dynamic risk-assessment tool. Instead of just seeing a premium of $1.50, you now understand that this premium represents an 85% probability of that option expiring worthless.
This analytical layer is what separates pure guesswork from a calculated, professional strategy. It’s what empowers you to move beyond hoping for a good outcome and start picking trades that give you a quantifiable, statistical edge.
All of these market-implied probabilities and expected moves are derived directly from the option chain. Platforms use pricing models that scan data across all strikes and expirations to figure out what the market is expecting. Specialized data providers supply the calibrated implied volatility surfaces and Greeks needed for these calculations, making this kind of high-level analysis possible.
Quantifying Risk and Reward
Once you start thinking in probabilities, you can make decisions with a whole new level of clarity. You can finally get objective answers to the questions that really matter before you ever put your money on the line.
- What’s the actual statistical chance of my covered call being assigned?
- How likely is it that I’ll have to buy the stock on this secured put?
- Is the premium I'm collecting actually worth the risk I’m taking on?
This approach lets you perfectly align every single trade with your personal risk tolerance. If you're a conservative investor looking for steady income, you can filter for trades with a high probability of profit. To dive deeper into this, check out our guide on the probability of profit in options.
This shift to a probability-based mindset is the single most important step in becoming a more disciplined and consistently successful options seller. It moves the process from an art based on intuition to a science based on data.
The pros are even taking this a step further, applying advanced techniques like machine learning for forecasting to spot complex patterns in option chain data. While that’s a pretty advanced application, it just goes to show how much valuable information is hiding in plain sight.
Ultimately, turning data into decisions means looking past the surface-level numbers. It’s about using the option chain to understand the odds, quantify your risk down to the percentage point, and systematically select trades that put the statistical advantage on your side.
Common Mistakes to Avoid When Reading an Option Chain
Jumping into the option chain is exciting, but it's a field littered with common traps that can turn a good idea into a costly mistake. Honestly, knowing what not to do is just as important as knowing what to do.
Let's walk through the most frequent errors I see traders make, so you can sidestep them from day one. Each one comes from a simple oversight, but the consequences can be huge. Learning to spot these red flags is what separates disciplined, successful options sellers from the rest.
Ignoring Liquidity for a High Premium
This is probably the most tempting trap of them all: chasing an unusually fat premium without first checking the option's liquidity. You spot a contract that looks like a home run, and the impulse is to grab it before anyone else does.
The problem? That huge premium is often a mirage. It's only there because virtually no one is trading that option.
Think of it like trying to sell a rare painting in a small town that has no art collectors. You can slap a high price tag on it, but good luck finding a buyer. Illiquid options work the same way and create two massive headaches:
- Wide Bid-Ask Spreads: The price you see (the mid-price) isn't the price you'll get. The bid might be way lower, vaporizing that "attractive" premium right off the bat.
- Getting Trapped: Need to close your position early? You might not find anyone on the other side of the trade. You're stuck holding the contract to expiration, even if things go south.
Before you do anything else, always glance at the Volume and Open Interest columns. If you see low numbers or zeros, that high premium isn't an opportunity—it's a warning sign.
Misunderstanding Implied Volatility
Implied Volatility (IV) is a classic double-edged sword. Yes, high IV means higher premiums, which is exactly what we're looking for as sellers. But too many traders see a high IV and think it's just free money, without asking the most important question: why is it so high?
A high Implied Volatility isn't a gift; it's the market's way of telling you to expect turbulence. Ignoring this warning is like selling insurance on a house while a hurricane is approaching—the potential payout is high, but so is the risk of total loss.
The textbook example is selling a secured put on a stock with soaring IV right before an earnings report. That juicy premium exists because it's pricing in a massive potential price swing. If the report bombs, the stock could crater well below your strike, forcing you to buy shares for far more than they're worth.
Always ask why the IV is juiced up before you place a trade.
Focusing Only on Premium Yield
It's so easy to just sort the option chain by the highest premium and pick the biggest number. This is a critical mistake, famously known as "picking up pennies in front of a steamroller."
Why? Because the highest premiums almost always belong to the highest-risk contracts—usually the ones that are at-the-money or very close to it.
Sure, the immediate income is tempting. But while you might collect a $200 premium on an at-the-money contract, you have a much greater chance of being assigned. If that happens, you could be looking at a loss that completely wipes out that initial gain and then some.
A much smarter, more sustainable approach is to balance the premium with the probability of the trade working out. Very often, a slightly smaller premium on a safer, out-of-the-money strike offers a far better risk-adjusted return over the long haul.
Stop guessing and start making data-driven decisions. Strike Price turns the complex option chain into a clear map of probabilities, showing you the real risk and reward of every trade. Find high-probability covered call and secured put opportunities that align with your financial goals. Get started today at https://strikeprice.app.