Open Interest vs Volume Options: A Trader's Clear Guide
If a stock moves past your strike, the option can be assigned — meaning you'll have to sell (in a call) or buy (in a put). Knowing the assignment probability ahead of time is key to managing risk.
Posted by
Related reading
A Step-by-Step Covered Calls Example for Consistent Income
Unlock consistent income with our step-by-step covered calls example. This guide breaks down the strategy, risks, and outcomes to help you trade confidently.
Long Call and Short Put The Ultimate Synthetic Stock Guide
Unlock the power of the long call and short put strategy. This guide explains how synthetic long stock works, its benefits, risks, and how to execute it.
What is a Call Spread? A Clear Guide to Bull and Bear Spreads
What is a call spread? Discover how bull and bear spreads limit risk and sharpen your options trading strategy.
At its core, the difference between Volume and Open Interest is pretty simple. Volume tells you how many options contracts changed hands today. Open Interest tells you how many contracts are still open and active, period.
Think of it like this: Volume is a daily scoreboard that resets to zero every morning. Open Interest is the running total of all players still in the game.
Understanding Core Options Trading Metrics
Volume and Open Interest are two of the most fundamental metrics you'll find on an options chain, but they tell very different stories. Both give you a sense of the market's pulse, but one measures the day's excitement while the other tracks the total commitment.
Volume is pure, unfiltered trading activity. It's the total number of contracts bought and sold in a single trading session. A high volume number means a lot of traders are jumping in and out of that specific option right now, signaling high liquidity and immediate interest.
Open Interest, on the other hand, is a cumulative count. It represents the total number of options contracts that are still held by traders and haven't been closed, exercised, or expired. It only changes when a new buyer and a new seller create a new contract, or when an existing position is closed out. This metric gives you a much broader view of the money and conviction behind a particular strike price.
This is exactly why learning how to read an options chain properly is so critical—these two numbers add a ton of context to the prices you see.
Volume vs Open Interest Core Differences
To put it plainly, Volume shows today's action while Open Interest shows the total skin in the game. This table breaks down the essential distinctions.
| Metric | What It Measures | Timeframe | Primary Signal |
|---|---|---|---|
| Volume | The total number of contracts traded. | Resets daily. | Measures current trading activity and liquidity. |
| Open Interest | The total number of active, unsettled contracts. | Cumulative, carries over daily. | Measures market participation and conviction. |
As you can see, they measure completely different aspects of market dynamics, which is why you need to look at both.
This chart does a great job of showing the two metrics side-by-side.

Notice how the daily Volume (the bars) jumps around a lot, reacting to daily news and sentiment. Meanwhile, Open Interest (the line) is a much larger, more stable number that reflects the total outstanding positions built up over time.
Interpreting the Metrics
So, how do you actually use this information?
I like to think of Volume as the chatter in a room. A sudden spike in volume is like a loud conversation breaking out—it tells you something is happening right now that has everyone's attention. High volume is great because it means there's a lot of liquidity, making it easier for you to get in and out of a trade without the price moving against you too much.
Open Interest is more like the number of people who decided to stay in that room for the party. It’s a measure of commitment. When you see open interest rising day after day, it tells you that new money is flowing in and traders are building new positions. This suggests a growing conviction that a big move might be on the horizon. It shows you the total capital at risk and how many participants are truly invested in that outcome.
How Market Activity Shapes Volume and Open Interest
While both volume and open interest tell you something about market activity, they tell very different stories. Volume is a simple tally, but open interest works on a more nuanced logic that shows whether money is flowing into or out of a specific option.
Getting this mechanical difference right is the key to understanding capital flows in the options market.
Volume is just the total number of contracts traded during the day. It doesn't matter if the trade is opening a new position, closing an old one, or just passing a contract from one trader to another—it all adds to the day's volume. Every morning, the count resets to zero.
Open interest, on the other hand, only changes when the total number of active contracts changes. This gives you a much cleaner signal about whether new money is entering a particular option or if existing capital is heading for the exits.
The Four Scenarios Affecting Open Interest
To really nail the open interest vs volume options dynamic, you have to see how individual trades move the numbers. Every transaction falls into one of four buckets, and each one affects open interest differently.
Let’s use a simple example: Trader A wants to buy a call, and Trader B wants to sell one.
New Buyer + New Seller (Open Interest Increases)
- Trader A opens a new long call position.
- Trader B opens a new short call position.
- Result: A brand-new contract is created. Volume and open interest both go up by one. This is a clear sign that fresh capital is entering the market.
Existing Buyer + New Seller (Open Interest is Unchanged)
- Trader A, who already owns a call, sells to close their position.
- Trader B opens a new short call position.
- Result: The existing contract is just handed off from Trader A to Trader B. Volume increases by one, but open interest stays the same. No new contracts were created or destroyed.
New Buyer + Existing Seller (Open Interest is Unchanged)
- Trader A opens a new long call position.
- Trader B, who was already short a call, buys to close their position.
- Result: Same as the last scenario—it’s just a transfer. Volume is up by one, but open interest doesn’t move.
Existing Buyer + Existing Seller (Open Interest Decreases)
- Trader A (existing long) sells to close.
- Trader B (existing short) buys to close.
- Result: An active contract is officially closed out and removed from the market. Volume ticks up by one, but open interest decreases by one. This signals that capital is leaving this specific option.
This distinction is critical. High volume might just be traders shuffling existing positions. But rising open interest confirms that new, committed capital is flowing in, which is often a much stronger market signal.
Understanding these mechanics is what turns raw numbers into real market insight. To do that, you need clean, reliable data. For traders who depend on accurate metrics, using a platform with access to real-time options data is non-negotiable. It ensures your analysis is based on what's happening right now, moving you past surface-level stats and toward a deeper read on market positioning.
Analyzing Market Conviction with Price and Volume
Watching volume and open interest as standalone numbers is a good start, but the real magic happens when you pair them with an option's price action. Putting all three together is how you get a feel for market conviction—the actual strength and commitment behind a price move.
Volume might show you there's a lot of chatter, but open interest tells you if new money is actually backing it up. By observing how price, volume, and open interest interact, you can get a much clearer picture of whether a trend is gaining strength, losing steam, or about to hit a wall. It’s the difference between hearing a rumor and seeing people actually place their bets.
Interpreting Market Strength and Weakness
Different combinations of price, volume, and open interest flash distinct market signals. Once you learn to spot these patterns, you can start validating your trading ideas with hard data.
For instance, a strong, healthy trend—whether it's bullish or bearish—is almost always confirmed by rising volume and rising open interest. This combo shows that not only is trading activity picking up (volume), but new, committed positions are being opened (open interest), adding fresh fuel to the move.
On the flip side, a price move on declining volume and open interest is a huge red flag. It’s a sign that the trend is running on fumes and the conviction behind it is fading. This could signal an upcoming reversal or a period of sideways chop, as current traders are closing out positions and no new money is stepping in.
Key Takeaway: Price tells you what is happening. Volume tells you how much activity is behind it. Open interest tells you if new money is committed to that direction. A strong trend needs all three pointing the same way.
How Different Scenarios Play Out
To really get the hang of open interest vs volume options analysis, let's break down the most common scenarios you'll see. Each one tells a unique story about what traders are thinking.
This visual shows exactly how different trades affect the total number of active contracts in the market.
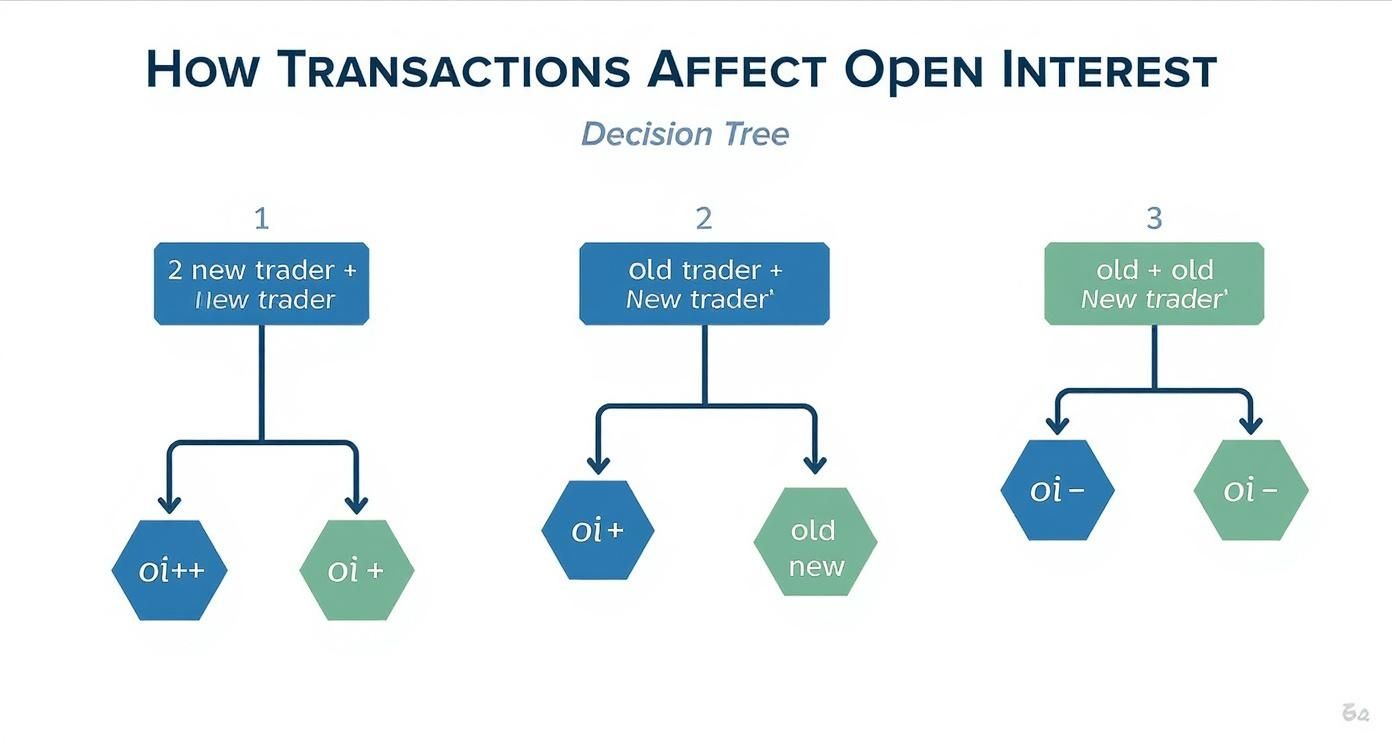
As you can see, open interest only goes up when two new traders create a contract. It goes down when two existing holders close one out. If a contract just changes hands, open interest stays flat.
Let's walk through the four main combinations you'll encounter.
1. The Bullish Confirmation
- Price: Increasing
- Volume: Increasing
- Open Interest: Increasing
This is the cleanest bullish signal you can get. Rising prices are backed by heavy trading and, crucially, new money flowing in. It signals strong conviction and suggests the uptrend has the legs to keep going.
2. The Bearish Confirmation
- Price: Decreasing
- Volume: Increasing
- Open Interest: Increasing
This is the polar opposite and the strongest bearish signal. Falling prices are met with high activity as new traders aggressively open short positions, signaling growing conviction to the downside.
3. The Weakening Uptrend (Short Squeeze)
- Price: Increasing
- Volume: High or Increasing
- Open Interest: Decreasing
This one can be tricky. The price is going up, but the falling open interest tells you it's because existing short sellers are buying to close their positions—not because new buyers are stepping in. This is a classic short squeeze. Once the shorts are done covering, the buying pressure vanishes, often leading to a sharp drop. The rally is hollow.
4. The Weakening Downtrend (Long Liquidation)
- Price: Decreasing
- Volume: High or Increasing
- Open Interest: Decreasing
Here, the price is dropping, but it’s driven by existing long holders selling to get out. No new, confident short sellers are entering the market. This suggests the selling pressure might be about to burn itself out, possibly setting the stage for a bottom.
This kind of nuanced analysis ties into other key options metrics, too. For example, understanding how implied volatility is influencing an option's price can add another critical layer to your analysis. If you want to go deeper, check out our guide on what is Vega in options, which explains how price sensitivity to volatility can shape your strategy.
Decoding Market Scenarios with Price Volume and OI
Think of this table as a cheat sheet for interpreting the combined signals of price, volume, and open interest. Use it to quickly size up the conviction behind any market move.
| Price Trend | Volume | Open Interest | Potential Market Interpretation |
|---|---|---|---|
| Rising | Increasing | Increasing | Strong Bullish Trend: New buyers are confidently entering the market. |
| Rising | Decreasing | Decreasing | Weakening Uptrend: Trend is losing momentum; likely profit-taking. |
| Rising | Increasing | Decreasing | Short Squeeze: Shorts are covering, a potential sign of a coming top. |
| Falling | Increasing | Increasing | Strong Bearish Trend: New sellers are actively opening short positions. |
| Falling | Decreasing | Decreasing | Weakening Downtrend: Trend is losing steam; longs are closing out slowly. |
| Falling | Increasing | Decreasing | Long Liquidation: Panic selling from longs; may signal a potential bottom. |
By mastering these interpretations, you can move beyond just looking at a price chart. You can start to understand the forces driving the price, giving you a serious edge in spotting high-conviction trades and sidestepping deceptive market fakes.
Applying These Metrics in Your Trading Strategy

Knowing the theory behind open interest and volume is one thing. Actually using it to make smarter trades is a different game entirely. These aren't just numbers on a screen; they're data points that show you exactly where the market's money and attention are focused. By building them into your analysis, you can stop just reacting to price changes and start anticipating them.
Think of it this way: Volume is your real-time guide to what's happening right now—liquidity, momentum, and immediate interest. Open interest, on the other hand, is the longer-term map showing where serious capital is already committed. Use them together, and you can confirm your trade ideas, spot high-probability setups, and sidestep common traps.
Using Volume to Pinpoint Entry and Exit Points
Volume is the market's pulse. It tells you where the action is happening in the moment. For active traders, it’s an essential tool for gauging immediate interest and ensuring you can get in and out of a trade smoothly. A sudden spike in volume is a powerful signal that something big is underway.
Here’s how you can put volume analysis to work:
- Confirming Breakouts: Ever see a price punch through a key resistance level on weak volume? That’s often a "false breakout" just waiting to reverse. But a breakout that happens with a massive surge in volume signals real buying conviction. It suggests the move has the fuel to keep going.
- Identifying Liquid Options: Before you even think about entering a trade, check for options with consistently high daily volume. High volume means tighter bid-ask spreads and a much better chance of getting your order filled at a fair price. If you try to trade illiquid, low-volume options, you're asking for slippage—where your entry or exit price is way worse than you expected.
- Spotting Intraday Momentum: Keep an eye on the volume bars throughout the day. If a stock is rallying but the volume on each new upswing gets smaller and smaller, that’s a red flag. It’s a sign that buying interest is fading, and it might be time to take profits or tighten your stop-loss.
A good rule of thumb is to look for options with daily volumes in the thousands, not just the hundreds. This ensures there are enough traders in the mix to create a competitive market for your position.
Leveraging Open Interest for Strategic Positioning
While volume is all about the now, open interest tells you about the what's next. It reveals where large pools of money are clustered, often pointing to key psychological price levels that can act as support or resistance. This becomes incredibly useful when you're planning trades around major events like earnings announcements.
Open interest is your window into institutional commitment and major price barriers.
Identifying Support and Resistance Levels
High open interest at a specific strike price is like a financial dam. If you see a massive number of put contracts open at the $100 strike, it means a lot of traders are betting the price will stay above that level. This can create a strong support floor, because the traders who sold those puts might step in and buy the stock to defend their positions if the price gets close to $100.
On the flip side, a huge cluster of open call contracts at the $120 strike can act as a powerful resistance ceiling. As the price approaches $120, traders who sold those calls might start selling the stock to hedge their exposure, putting a lid on the rally.
A Hypothetical Earnings Trade Example
Let's say Company XYZ reports earnings next week. You pull up the options chain and notice an unusually large amount of open interest on the $50 puts and the $60 calls that expire right after the report.
- The Signal: The market is making a collective bet that XYZ will trade somewhere between $50 and $60 after the news hits. The high open interest at these strikes tells you they are major points of contention.
- The Strategy: This insight helps you structure a smarter trade. If you’re bullish, you might sell the $50 puts, collecting premium while aligning yourself with that area of perceived support. If you're bearish, you could sell the $60 calls to capitalize on the expected resistance. Instead of just guessing, the open interest data gives you a data-driven range to work within.
By pairing the immediate feedback from volume with the strategic foresight from open interest, you can build a far more robust and informed trading plan. This dual analysis of open interest vs volume options is a signature move of experienced traders who know how to read the market’s underlying story.
Common Misinterpretations and Analytical Pitfalls
Diving into open interest and volume can give you a real edge, but it's also where a lot of traders stumble. These metrics are powerful, but they’re not magic. Misreading the signals can turn what looks like a perfect setup into a painful loss.
The biggest issue? Neither metric gives you the full picture on its own. They're just pieces of a puzzle. Focus on one, and you'll get a distorted view of what's really happening in the market. To avoid these traps, you have to know what these numbers don't tell you and how they can be misleading when viewed in a vacuum.
The Myth of High Volume
One of the most common mistakes is thinking high volume automatically means a trend is strong. Sure, a big price move on heavy volume can be a great sign, but it’s not a guarantee. High volume just tells you a ton of contracts were traded. It doesn't tell you why.
For instance, a volume spike could be driven by:
- Panic Selling: A wave of traders all rushing to close their long positions at once.
- Short Covering: Traders who bet against the stock are forced to buy back their options, creating a temporary surge of buying.
- Position Rolling: Traders are simply closing an option that's about to expire and opening a new one further out in time.
In these situations, the volume spike is about traders getting out or shuffling positions around, not new money confidently getting in. This is a classic trap in the open interest vs volume options debate—without open interest to provide context, volume alone can be seriously deceptive. A trend built on closing positions is shaky at best.
Open Interest Is Not a Price Magnet
Another trap is treating a strike with massive open interest as some kind of price magnet that the stock is destined to hit by expiration. While these levels are often significant areas of support or resistance, they aren't unbreakable walls.
Huge open interest at a strike means a lot of money is on the line, creating an incentive for big players and market makers to defend that level. But a powerful market trend or a surprise news event can steamroll right through that positioning.
Think of high open interest as a potential battleground, not a predetermined outcome. It shows you where a fight might happen, but it doesn't tell you who's going to win.
The Danger of Isolated Analysis
The single biggest mistake is looking at one metric without the other—and, crucially, without price action. Looking at volume alone, you miss whether the trades are opening new positions or closing old ones. Staring at open interest without volume, you miss the immediate activity and momentum.
This leads to bad assumptions:
- "Volume is high, this trend is strong!" Not if open interest is falling. That's more likely a short squeeze or traders liquidating their longs.
- "Open interest is rising, new money is flowing in!" Maybe, but if volume is weak, there’s no real conviction behind the move. The trend could fizzle out fast.
The real insight comes from putting them together. High volume plus rising open interest is the combo you want to see. That confirms the action is driven by new, committed capital—a far stronger signal than either metric provides on its own.
Forgetting the Timing Difference
Finally, traders often forget that these two data points operate on different timelines. Volume is a real-time indicator. It updates constantly throughout the day, showing you what’s happening right now.
Open interest, on the other hand, is an end-of-day snapshot. It's calculated after the market closes and tells you the total number of positions carried over to the next day. This means you can't see it changing live. Trying to interpret today's live volume using yesterday's open interest can lead you astray. Always remember you're comparing today's live action (volume) with yesterday's closing sentiment (open interest).
Frequently Asked Questions About Open Interest and Volume
Even when you've got the basics down, the way open interest and volume interact can still raise questions. These aren't static numbers; they're dynamic metrics, and getting the finer points right is what separates a good trade from a great one. We'll tackle some of the most common questions traders have, clearing up the nuances to sharpen your analysis.
Think of this as bridging the gap between knowing what these metrics are and truly understanding how they behave in the wild.
Can Volume Be Higher Than Open Interest?
Yes, and it happens all the time. You’ll often see this in options with short-term expirations or around big market events like an earnings release or a Fed announcement. It’s because volume tracks every single contract that changes hands during the day, while open interest only counts the net number of contracts left open at the close.
Picture a hot option on a volatile day. Thousands of contracts might be opened and closed within hours by day traders jumping on quick price moves. Someone could buy 100 contracts in the morning and sell them an hour later. That single round trip adds 200 to the day's volume but changes the open interest by exactly zero.
When you see volume blowing past the open interest figure, that's your signal for heavy intraday trading and speculation. It tells you a lot of traders are playing short-term momentum, not holding positions overnight.
Which Is More Important: Open Interest or Volume?
This is a classic trap. Neither one is "more important"—they're two different tools for two different jobs. The real power comes from using them together to get the full story.
Here’s the simplest way to think about their roles:
- Volume tells you about immediate activity and liquidity. It answers the question, "Is anyone trading this contract right now?" High volume is what you need to get in and out of a trade smoothly with a tight bid-ask spread.
- Open Interest measures market participation and commitment. It answers, "How much money is staked on this strike price over the long haul?" High open interest shows that a level is strategically important to a lot of traders.
A great analogy is a political rally. Volume is the noise—the cheering and chanting happening at any given moment. It shows excitement. Open interest is the headcount—the number of people who actually showed up and are sticking around. You need both to know if the rally has real substance.
How Does Open Interest Affect Liquidity?
Higher open interest usually leads to better liquidity, but it's more of an indirect relationship. While volume is your direct gauge of liquidity, a big base of open interest creates the perfect environment for healthy volume to thrive.
When an option has a ton of open contracts, it acts like a magnet, pulling in more market participants like institutions and market makers. This extra attention means more buyers and sellers are always hanging around, which naturally creates:
- Tighter Bid-Ask Spreads: More competition means the gap between buy and sell prices shrinks, which saves you money on every trade.
- Greater Market Depth: A deep pool of open positions usually means more contracts are available at different prices, letting you fill larger orders without moving the market against yourself.
High open interest is a sign that a particular strike is a major battleground where serious capital is on the line. That significance draws in daily trading, which is what actually boosts liquidity. So, look to volume for real-time liquidity, but look to open interest as a forecast for where liquidity is likely to stay strong.
What Does High Volume Mean in Options?
High volume is an attention-grabber. It signals intense, focused interest in a specific option contract right now. It’s a bright, flashing light telling you that traders are actively buying and selling, creating a liquid and dynamic market for that strike.
But on its own, high volume is just noise. It just means a lot of contracts were traded; it doesn't tell you why. To get the real story, you have to put it in context with price action and open interest.
For instance, a sudden volume spike could mean a few different things:
- New Bullish Bets: Traders are aggressively buying calls, which you'd confirm by seeing open interest rise.
- Panic Selling: Existing holders are rushing for the exits, which would cause open interest to fall.
- Short Covering: Traders who bet against the option are being forced to buy back their positions, often seen with rising prices but falling open interest.
In short, high volume is your cue to dig deeper. It confirms that a price move has real energy behind it, but you need other indicators to figure out the direction and staying power of that energy.
Ready to move beyond theory and apply these insights with confidence? Strike Price provides real-time probability metrics and smart alerts that integrate volume and open interest data, helping you identify high-conviction opportunities. Stop guessing and start making data-driven decisions to generate consistent income from your options strategy. Discover how Strike Price can transform your trading today!