A Trader's Guide to Option Probability Calculators
If a stock moves past your strike, the option can be assigned — meaning you'll have to sell (in a call) or buy (in a put). Knowing the assignment probability ahead of time is key to managing risk.
Posted by
Related reading
Out of Money Call Options A Guide to Consistent Income
Learn how to use out of money call options to generate consistent income. This guide covers key strategies, risk management, and real-world examples.
How Options Are Priced A Practical Guide for Investors
Understand how options are priced with this clear guide. Learn about intrinsic value, implied volatility, and pricing models to improve your investing strategy.
Greek Options Explained for Income Traders
Unlock your options trading potential. This guide on greek options explained shows you how to use Delta, Gamma, and Theta to generate consistent income.
An option probability calculator is a deceptively simple tool. At its core, it takes complex market data—stock price, strike price, time, and volatility—and boils it all down to a single, powerful percentage: the odds of an option finishing in-the-money.
For traders looking to move beyond gut feelings, this is a game-changer. It allows you to make decisions based on statistical likelihoods, not just hunches.
Why Option Probability Calculators Give You an Edge

Making the leap from hopeful guessing to data-backed trading is a defining moment for any serious investor. An option probability calculator is one of the most important tools for making that transition happen.
It’s not a crystal ball. No tool can predict the future with 100% certainty. Instead, it’s about stacking the statistical odds in your favor before you put your capital on the line.
Think of it as your personal risk assessment engine. Instead of just wondering if a stock will hit a certain price, you get to see the mathematical probability of it happening, calculated from live market conditions.
A Quick Look at the Math Behind the Magic
The ideas powering these calculators aren't new; they're rooted in the famous Black-Scholes model, which first came on the scene back in 1973. For decades, this kind of financial modeling was reserved for the pros. Today, online tools make it accessible to everyone.
A quick calculation might reveal that a stock has a 30-35% chance of reaching a specific strike price. That single piece of information is invaluable when you're deciding which option to sell. This ease of access has helped fuel a massive surge in options trading, with global daily volumes now regularly topping 40 million contracts.
For a deeper dive into how these tools work, check out our full guide to the options probability calculator.
The real power of a probability calculator is that it forces you to think in terms of risk versus reward. It shifts your focus from "Will this trade win?" to "What are the statistical chances of this trade succeeding, and is the potential reward worth the risk?"
To get those probabilities, you'll need to feed the calculator a few key pieces of information. Each one plays a critical role in the final calculation.
Key Inputs for Your Option Probability Calculator
The table below breaks down the essential data points you'll need to use the calculator effectively and what each one represents in your trading strategy.
| Input | What It Represents | Why It's Critical |
|---|---|---|
| Current Stock Price | The underlying asset's real-time market value. | This is the starting point for all calculations; every probability is relative to where the stock is trading now. |
| Strike Price | The price at which you agree to buy or sell the stock. | This defines your target and is the price the calculator measures the probability of reaching. |
| Days to Expiration | The time remaining until the option contract expires. | Time is a key component of an option's value. More time generally means a higher chance the stock can reach the strike. |
| Implied Volatility (IV) | The market's expectation of future price swings. | High IV suggests the market expects bigger moves, increasing the probability of reaching a strike price (and boosting premium). |
| Interest Rate | The risk-free interest rate (e.g., Treasury bill rate). | While its impact is smaller, it's part of the standard pricing model and affects the theoretical value of the option. |
Once you plug in these variables, the calculator does the heavy lifting, turning complex financial theory into a simple, actionable percentage.
The Core Benefits for Traders
When you start incorporating probabilities into your routine, you’ll notice a few key advantages almost immediately:
- You can actually quantify your risk. Instead of relying on a "feeling," you get an objective number to anchor your decisions. Is a 15% chance of assignment worth the premium? Now you can make an informed choice.
- You'll select better strike prices. You can systematically scan for strike prices that match your personal risk tolerance, whether you’re aiming for maximum safety or higher income.
- You’ll build consistency. By grounding your trades in data, you create a repeatable process. Over the long haul, a consistent, data-driven approach is what separates successful traders from the rest.
Finding the Right Inputs for Accurate Predictions
Any options calculator is only as good as the numbers you put into it. It's the old "garbage in, garbage out" problem. To get a probability you can actually trust, you need to feed the tool precise, real-time information for the exact trade you're considering.
This boils down to four key pieces of data: the current stock price, the specific strike price you're looking at, the exact days to expiration, and the most important (and trickiest) one: implied volatility (IV).
Why Implied Volatility Is The Key
The first three inputs are pretty straightforward, but implied volatility is where a lot of traders get tripped up. It’s absolutely critical to use the current IV for the specific option contract you’re analyzing—not just the stock's overall historical volatility.
Why? Because IV reflects the market's live expectation of future price moves. It’s the real engine behind how options are priced and how their probabilities are calculated.
Let's say we're looking at a popular ETF like SPY. Here’s what we’d need to gather:
- Underlying Price: The current price of SPY.
- Strike Price: The specific call or put strike we want to analyze.
- Days to Expiration (DTE): How many days are left until that option expires.
- Implied Volatility: The IV percentage for that specific strike and expiration.
This quick visual shows how nailing these inputs is the first step to getting a clear probability.
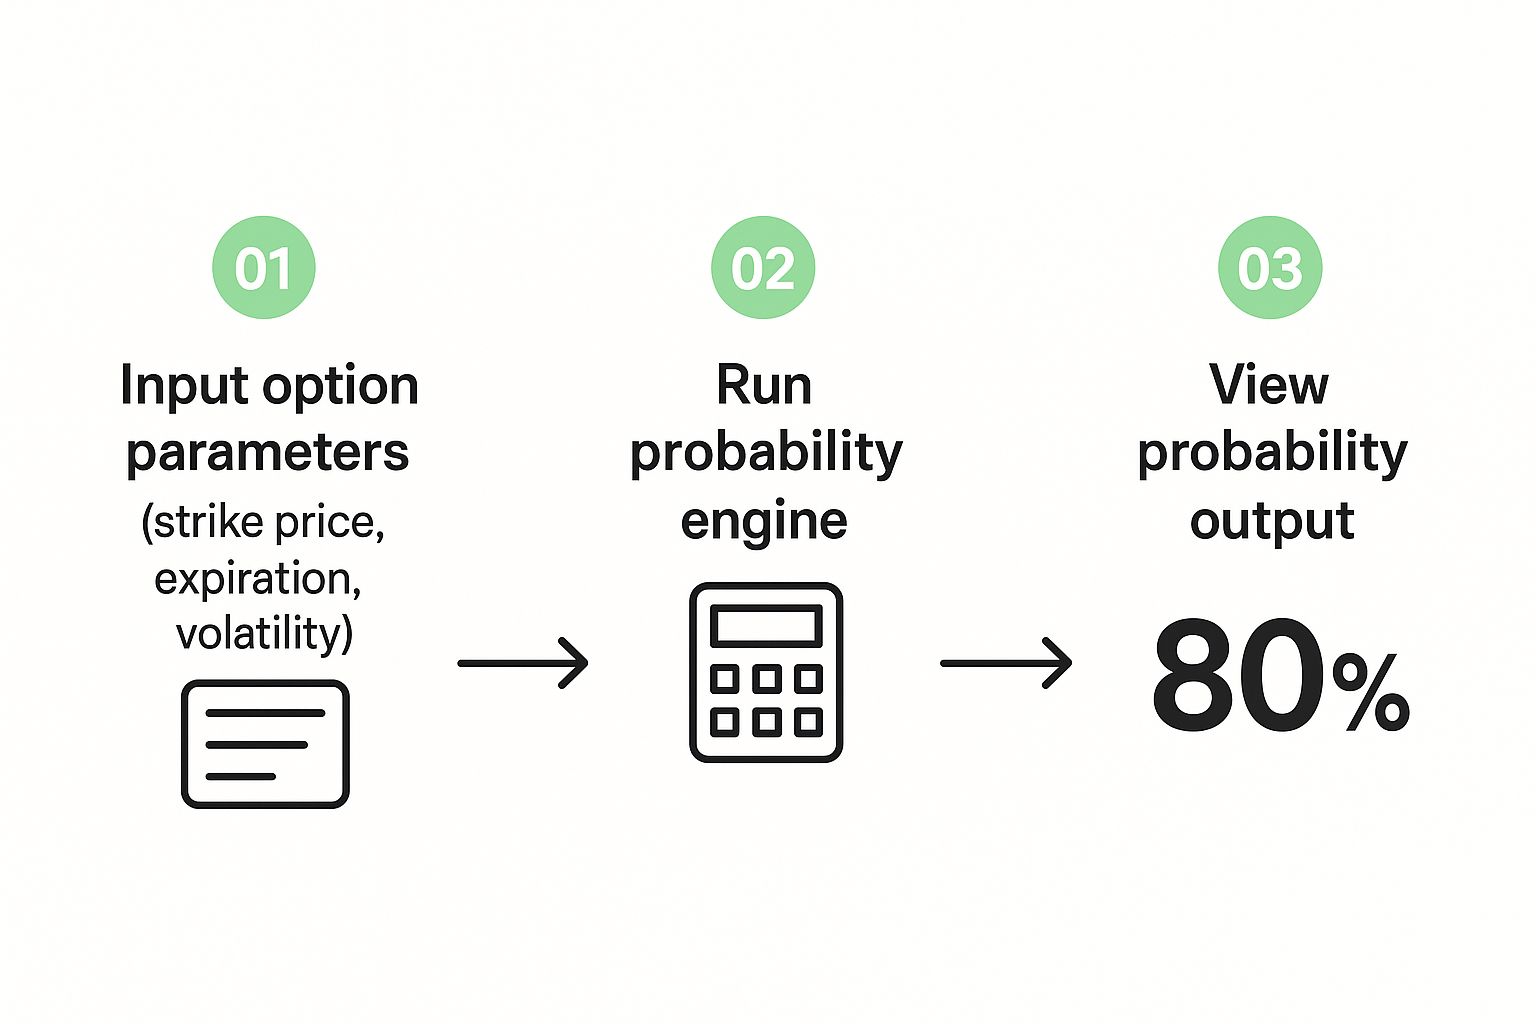
As you can see, getting accurate inputs is the foundation. Only then can the calculator do its job and give you a number you can build a strategy around.
One of the most common mistakes I see is traders using a stock's general IV instead of the IV for the specific option they're trading. Different strikes and expiration dates all have their own unique IVs. Using the right one is essential for an accurate reading.
Luckily, you don't have to guess. Most modern trading platforms and exchanges make finding this data pretty simple. For instance, the CBOE's strategy builder shows you exactly where to plug in this information.
By taking the time to use accurate, real-time data for every single trade, you turn a probability calculator from a simple gimmick into a genuinely powerful tool for making smarter decisions.
Turning Probability Numbers Into Trading Decisions
Alright, so the option probability calculator spits out a number. Now what? This is where the real work of a trader begins. That percentage isn't just a piece of data; it's a signal telling you how to structure your trade. The trick is to turn that abstract number into a concrete action that fits your personal goals.
One of the first things that trips people up is understanding the two main metrics a calculator gives you. It's really important to know which one you should be paying attention to for your specific strategy.
Probability of Touching vs. Expiring ITM
An option's "Probability of Touching" a strike price is almost always higher than its "Probability of Expiring In-The-Money (ITM)." I like to think of it like a weather forecast. There might be a 50% chance of a quick shower sometime during the day (touching), but only a 20% chance it will actually be raining when you leave work at 5 PM (expiring ITM).
Probability of Touching (PoT): This is the chance the stock will hit your strike price at any single moment before the option expires. This number is a big deal for traders who plan to actively manage or close positions early, since a "touch" can trigger all sorts of alerts, stop-losses, or profit-taking orders.
Probability of Expiring ITM: This is the probability the option will be in-the-money right at the moment of expiration. For those of us selling options for income—like with covered calls and cash-secured puts—this is the number that really counts.
For most income strategies, your eyes should be glued to the probability of expiring ITM. Your goal is for the option to expire worthless so you can pocket the full premium. That means you want this probability to be low.
I see these probabilities as risk gauges. A high probability of your option expiring worthless means you'll likely collect a smaller premium. A lower probability means a higher premium but more risk. Your job is to find the sweet spot on that gauge that matches your personal risk tolerance.
A Practical Example of Decision Making
Let's walk through a real-world scenario. Imagine you're looking to sell a cash-secured put. Your option probability tool shows the strike you're eyeing has a 75% probability of expiring worthless. This is the same as saying it has a 25% chance of expiring ITM.
This single data point frames your entire decision. A 75% probability of success gives you a solid statistical edge. It signals a relatively conservative trade, perfect for an investor who prioritizes preserving capital and earning consistent—if smaller—income.
But what if you're feeling a bit more aggressive and want a bigger premium? You might look for a strike with a 60% probability of expiring worthless. By doing so, you're consciously accepting a higher risk of being assigned the stock in exchange for more cash upfront.
Ultimately, the calculator doesn't make the decision for you. It shines a bright light on the trade-offs. It gives you the clear, hard numbers you need to choose the path that feels right for your financial goals and your comfort with risk.
Using Probabilities for Smarter Covered Calls
Alright, let's move this from theory to practice with one of the most popular income strategies out there: the covered call. An option probability calculator is your best friend here, helping you pick a strike price that perfectly matches what you want to achieve with the trade.
It all boils down to your primary goal. Are you playing it safe, aiming for steady income while doing everything you can to keep your shares? Or are you willing to aim for a bigger premium, even if it means a higher chance your shares get called away? The calculator gives you the hard data to make either move with confidence.
Targeting for Income and Keeping Your Shares
If your main objective is to hang onto your shares and just collect a nice, steady premium, you’ll want to sell calls with a high probability of expiring worthless. This is a go-to strategy for a lot of long-term investors who just want to squeeze some extra yield out of their holdings.
Looking at your calculator, you’d hunt for a strike price with an 85% or higher probability of expiring out-of-the-money (OTM). That high probability means the market is giving you strong odds of keeping both your stock and the full premium. The trade-off, of course, is that the premium you collect will be on the smaller side compared to more aggressive strikes.
A great little shortcut is to use the option's Delta. A .15 Delta call option has roughly a 15% chance of expiring in-the-money—which is just another way of saying it has an 85% chance of expiring worthless. This trick makes it incredibly easy to spot good candidates right from your trading platform.
Targeting for Higher Premiums
On the flip side, maybe you're perfectly fine with your shares being sold. Perhaps the stock has hit a price target where you'd be happy to take profits anyway. In this scenario, you can use the calculator to find a strike that pays a much more attractive premium.
Here, you might target a strike with a 60-70% probability of expiring OTM (which corresponds to a .30 to .40 Delta). By accepting these lower odds, you significantly boost the premium you pocket. You're making a calculated decision: the extra income is worth the increased risk of getting your shares assigned.
Nailing this balance is a huge part of learning when to sell covered calls. The calculator makes this trade-off crystal clear, replacing guesswork with a strategic, data-driven choice.
Executing Strategic Secured Puts with Confidence
 Let’s flip the script from covered calls to another fantastic income strategy: the secured put. This is a powerful tool, whether you're trying to scoop up shares of a stock you love at a discount or just aiming to generate steady premium income.
But to do it right, you need data. An option probability calculator gives you the hard numbers you need to move from guessing to executing with precision. It's all about aligning the trade with what you actually want to accomplish.
Just like with covered calls, your end goal should be the single biggest factor in picking your strike price. The outcome you’re aiming for directly points to the probability you should be targeting.
Selling Puts Purely for Income
If your main objective is collecting premium and you’d rather not end up buying the stock, the game plan is pretty simple. You want to sell puts with a very high probability of expiring worthless—or out-of-the-money (OTM).
For this goal, you'll fire up the calculator to find a strike price that has an 80% or greater chance of expiring OTM. This is a conservative play. You're trading a smaller premium for a much higher statistical chance of simply keeping the cash and getting ready to do it all over again.
From my experience, here's a quick mental shortcut: selling a .20 Delta put is essentially the same as picking an 80% OTM probability. This little trick lets you spot high-probability income trades right from your trading platform's option chain, which can save you a ton of time.
Selling Puts to Buy a Stock at a Discount
What if you genuinely want to own the stock, but only at a better price than it's at today? This is where the secured put really shines. You literally get paid to wait for the entry point you want.
In this scenario, you're actually looking for a strike with a higher chance of being assigned. You might target a put with a 35-40% probability of finishing in-the-money. This strike still offers an attractive premium, but it also gives you a solid shot at buying the shares at the price you set.
The calculator takes the emotion out of the equation and shows you the statistical trade-off in black and white.
If you're looking to really nail this approach, we have a complete guide on how to sell covered puts that dives into more examples and best practices. Whether it’s for income or acquisition, using probabilities is what turns a good plan into a confident trade.
Questions I Hear All the Time
Even with the best tools, questions always come up. When you first start using an option probability calculator, it's completely normal to have a few things you're not sure about. Let's walk through some of the most common ones I hear from traders so you can start using these numbers with more confidence.
How Reliable Are These Probabilities, Really?
This is the big one, and it's a fair question. An option probability calculator is incredibly reliable for what it does: it's a statistical tool that uses current market data, especially implied volatility, to calculate mathematical odds. It's not a crystal ball.
Think of it like a sophisticated weather forecast. The forecast gives you a highly educated guess based on real-time atmospheric data. But a sudden, unexpected storm front—the market's version of a surprise earnings bomb or geopolitical news—can always change the outcome. What it gives you is a statistical edge, not a guarantee.
What’s a "Good" Probability for Selling Options?
There's no magic number here. The right probability depends entirely on your own strategy and how much risk you're comfortable with. It’s always a trade-off.
- For conservative traders: If your main goal is generating steady income while protecting your capital, you might stick to options with a 75% to 90% probability of expiring worthless. You'll get smaller premiums, but you'll sleep better.
- For more aggressive traders: If you're chasing higher premiums and are okay with taking on more risk, you might dip down into the 60% to 70% probability range.
The "right" number is the one that fits your goals for that specific trade. It’s all about finding that sweet spot on the risk-reward scale where you feel in control.
The question isn't "What's the best probability?" but rather "Which probability best matches my objective for this specific trade?" Answering that is the key to using these numbers effectively.
Does This Only Work for Covered Calls and Puts?
Absolutely not. The core principles of probability apply to every options strategy out there. While we've focused on covered calls and secured puts, you can use these same concepts to size up the risk on any trade you can cook up—from credit spreads and iron condors to debit spreads.
In fact, more advanced platforms can even calculate the probability of an entire multi-leg position being profitable at expiration. The idea is always the same: you're using real market data to put a number on your risk so you can make a smarter decision. This is why getting a handle on probabilities is such a foundational skill for any serious options trader.
Ready to stop guessing and start trading with a statistical edge? Strike Price provides real-time probability metrics for every strike, smart alerts, and a dashboard to track all your positions. Turn guesswork into a strategic, income-generating process. Explore Strike Price today!