Options The Greeks Explained For Modern Traders
If a stock moves past your strike, the option can be assigned — meaning you'll have to sell (in a call) or buy (in a put). Knowing the assignment probability ahead of time is key to managing risk.
Posted by
Related reading
A Step-by-Step Covered Calls Example for Consistent Income
Unlock consistent income with our step-by-step covered calls example. This guide breaks down the strategy, risks, and outcomes to help you trade confidently.
Long Call and Short Put The Ultimate Synthetic Stock Guide
Unlock the power of the long call and short put strategy. This guide explains how synthetic long stock works, its benefits, risks, and how to execute it.
What is a Call Spread? A Clear Guide to Bull and Bear Spreads
What is a call spread? Discover how bull and bear spreads limit risk and sharpen your options trading strategy.
In options trading, the "Greeks" are a handful of metrics that tell you exactly how an option's price is expected to react to market changes. Think of them as the instrument panel for your trading account, giving you a live read on how shifts in stock price, time, and volatility will impact your bottom line.
What Are The Greeks In Options Trading?

Imagine trying to fly a modern jet without any gauges. Sure, you might be able to guess your altitude and speed, but you’d essentially be flying blind, totally exposed to any sudden change in conditions. Trading options without understanding the Greeks is pretty much the same thing—you’re making moves based on gut feelings instead of hard data.
The Greeks answer the question of why an option is priced the way it is. They break down a contract's complex value into a few core risk factors, giving you a clear look under the hood. More importantly, they help you predict how that price will behave tomorrow.
The Five Key Metrics for Smarter Trading
Each of the five major Greeks isolates a specific market force, giving you a multidimensional view of your position’s risk and potential reward. They are all derived from mathematical models—most famously the Black-Scholes formula from 1973—that quantify an option's sensitivity to change. If you're curious, you can explore a deeper history of these pricing models and see how they evolved.
Here’s a quick intro to each of the five major Greeks and the primary market factor they measure. This table is your cheat sheet before we dive into the details of each one.
A Quick Guide To The Five Major Greeks
| The Greek | What It Measures | Primary Influencing Factor |
|---|---|---|
| Delta | How much an option's price moves for every $1 change in the stock. | Directional Risk |
| Gamma | The rate of change in Delta. It's the acceleration of your position. | Directional Risk |
| Theta | The daily value an option loses as it nears expiration. It's the clock. | Time Decay |
| Vega | How sensitive an option's price is to changes in implied volatility. | Volatility |
| Rho | How an option's price reacts to a change in interest rates. | Interest Rates |
Mastering these five metrics is the difference between being a passenger and being the pilot.
By mastering these five metrics, you shift from simply buying or selling contracts to strategically managing a portfolio of probabilities. It’s the difference between being a passenger and being the pilot.
From Theory to Practical Application
Understanding these concepts is the first step.
Instead of just guessing how a big market event might affect your trade, you can look at Vega to see your volatility risk. Instead of being blindsided by a loss on a stock that's gone nowhere, you can check Theta to understand the daily cost of just holding your position.
This guide will demystify each Greek one by one, turning abstract theory into a practical toolkit for making smarter, more confident trading decisions.
Understanding Delta: Your Position's Speedometer

If you imagine the Greeks as the dashboard for your trading account, Delta is your speedometer. It's usually the first metric traders learn, and for good reason—it answers the most important question you can ask about your option: How much will my option's price change if the stock moves by $1?
Delta measures an option's sensitivity to the underlying stock's price, what traders call directional risk. It's the go-to metric for anyone placing a directional bet or, just as importantly, trying to hedge one away. It lets you move past just being "bullish" or "bearish" and start measuring exactly how bullish or bearish your position really is.
How To Read The Delta Scale
Delta is measured on a simple scale: from 0 to 1.0 for call options and 0 to -1.0 for put options. The sign tells you everything you need to know. Calls benefit when a stock goes up (a positive relationship), while puts benefit when a stock goes down (a negative relationship).
Let's say you own a call option on XYZ stock with a Delta of 0.50. This number is your guide. For every $1 increase in XYZ's stock price, your option's premium should increase by about $0.50, assuming nothing else changes. If the stock drops by $1, your option's value will fall by that same $0.50.
Now flip it. Imagine a put option with a Delta of -0.40. If the stock drops by $1, the put option’s value is expected to increase by $0.40. That negative sign signals the inverse relationship.
Key Takeaway: Think of Delta as your real-time guide to an option's price sensitivity. A high Delta (near 1.0 or -1.0) means the option will act a lot like the stock itself. A low Delta (near 0) means it's less responsive to small moves in the stock.
This brings us to another powerful way to think about Delta: as "stock equivalence." A call option with a 0.50 Delta will, from a purely directional standpoint, behave like owning 50 shares of the stock. For a closer look at this idea, check out our deep dive on what Delta is in options trading.
Using Delta To Gauge Probability
Delta isn't just a speedometer; it has a second, incredibly useful job. It acts as a quick-and-dirty estimate of the probability that an option will expire in-the-money (ITM).
An option with a Delta of 0.30 has, roughly speaking, a 30% chance of finishing ITM by expiration. This dual role makes Delta an invaluable tool for sizing up the risk and reward of a trade with just a single glance.
This is why at-the-money (ATM) options—where the strike price is right next to the current stock price—tend to have Deltas around 0.50 for calls and -0.50 for puts. The market is essentially pricing in a coin-flip, a 50/50 chance of the stock finishing above or below that strike.
Here's how Delta values generally line up with an option's "moneyness":
- Deep In-the-Money (ITM): Deltas hug 1.0 (calls) or -1.0 (puts). These options move almost dollar-for-dollar with the stock.
- At-the-Money (ATM): Deltas are right around 0.50 (calls) or -0.50 (puts), offering a good balance of responsiveness and premium cost.
- Out-of-the-Money (OTM): Deltas are close to 0. These are less sensitive to small stock moves but can come to life if the stock makes a big run toward the strike.
Putting Delta Into Practice
Experienced traders don’t just watch Delta; they actively manage it. By combining different options, a trader can build a position with a very specific net Delta, fine-tuning their exact level of market exposure.
A common example is a covered call, where a trader who owns stock sells a call option against it. This move reduces the overall positive Delta of their stock, lowering their directional risk in exchange for some income.
The next level up is creating a delta-neutral strategy. Here, a trader constructs a portfolio of options (and maybe stock) where the positive and negative Deltas completely cancel each other out, resulting in a net Delta of zero. The goal isn't to bet on direction but to profit from other factors, like time decay (Theta) or changes in volatility (Vega). This is a cornerstone of professional trading and shows how the Greeks are the building blocks for much more sophisticated strategies.
Mastering Gamma: The Accelerator Of Your Position
If Delta is your option's speedometer, then Gamma is the accelerator pedal. Simple as that.
While Delta tells you how much your option's price will move for every $1 change in the stock, Gamma tells you how fast your Delta itself is going to change. It's the rate of change of Delta, and it's what gives options trading its explosive potential.
Think of it like flooring it in a high-performance car. You don't just move forward; you lunge forward. High Gamma does the same thing to your option's Delta. A small move in the stock can cause your Delta to ramp up dramatically, creating a powerful snowball effect on your profits—or, just as easily, your losses.
This is why you'll often hear Gamma called a "second-order" Greek. It doesn't directly measure the impact of the stock price on your option's premium. Instead, it measures the impact on Delta, which then impacts your premium. It's one step removed, but its effect is anything but subtle.
Why Gamma Matters For Your Trades
Understanding Gamma is all about understanding the stability—or instability—of your position.
A position with low Gamma is predictable. Its Delta will be relatively stable, so your directional risk won't swing wildly with every little price tick. It’s a calmer ride.
On the other hand, a high Gamma position is dynamic and extremely sensitive. Your Delta can shoot from low to high in a flash, turning a tame position into a highly aggressive one. This is the classic double-edged sword. It can lead to massive gains if you're on the right side of the trade, but it can magnify your losses just as quickly if the market turns against you.
Key Insight: Gamma is always highest for at-the-money (ATM) options, especially as they get closer to their expiration date. Why? Because the market is most uncertain about whether these options will finish in or out of the money, making their Delta incredibly sensitive to the smallest price changes.
The Real-World Impact Of Gamma Risk
The biggest danger with Gamma, often called "gamma risk," rears its head when you're dealing with short-dated options around a big event like an earnings report.
When you buy an option, you have positive Gamma, which is great. It works for you. If the stock moves in your favor, your Delta increases, accelerating your gains and letting you ride the trend.
But when you sell an option, you're on the other side of that coin. You have negative Gamma, and this is where things get tricky.
- If you sell a call option: As the stock price rises, the option's negative Delta gets even more negative, fast. Your position becomes more bearish just as the stock is going up, forcing you to hedge by buying shares at higher and higher prices.
- If you sell a put option: As the stock price falls, the option's positive Delta (from the buyer's perspective) gets stronger, making your short put position more bullish. You're forced to hedge by selling stock at lower prices, chasing the market down.
This constant, frantic need to adjust your hedge is what makes being "short Gamma" one of the most challenging positions to manage in options trading.
How Time And Volatility Affect Gamma
Gamma's behavior is tied directly to the time left until an option expires. For at-the-money options, Gamma skyrockets as the expiration date gets closer. This creates a high-stakes environment where tiny stock movements can trigger huge swings in an option's value.
Just look at the S&P 500 options market. In the final days before expiration, Gamma values can spike to levels 5 to 10 times higher than they were just a few weeks earlier. That’s a massive increase in price sensitivity. If you want to see how these values move in real-time, you can explore live option price data and watch it happen.
Experienced traders are obsessed with Gamma, especially when managing positions around market-moving news. They know that while high Gamma can generate lightning-fast profits, it also brings a ton of instability. By keeping a close eye on this powerful metric, they can anticipate how their risk profile is about to change and make smart adjustments, turning Gamma from a huge risk into a tactical weapon.
Using Theta To Understand Time Decay

Of all the Greeks, Theta is probably the easiest to wrap your head around. It measures something we all experience every single day: the unstoppable march of time.
Imagine your option contract is a melting ice cube. Every day, a little bit of it disappears. Theta tells you exactly how much value is expected to melt away each day, assuming the stock price and volatility don’t change.
It's almost always shown as a negative number for options you buy, because time decay is a cost. It's a headwind you're constantly fighting. For example, a call option with a Theta of -0.05 is set to lose about $5 in value by tomorrow morning from time decay alone. This daily erosion is simply the "cost of holding" the contract.
The Seller's Best Friend And The Buyer's Opponent
This relentless decay creates a natural tug-of-war in the options market. If you're an option buyer, Theta is your enemy. You need the stock to move enough—and fast enough—to outrun this daily bleed.
But for an option seller, Theta is your best friend. When you sell an option and collect that premium, your goal is for the contract to slowly lose value and expire worthless. Every day that passes, Theta pushes the trade a little further in your favor.
Key Takeaway: Time is a real asset in options trading. Option sellers are literally "selling time" to buyers who need it for their predictions to come true. This is the entire premise behind income strategies like covered calls.
This is why so many traders focus on strategies that involve selling options. It allows them to profit from the simple passage of time, turning a flat or sideways market into a money-making opportunity.
How The Time Decay Curve Accelerates
Here’s the catch: time decay isn’t a slow, steady drip. It’s more like a waterfall that gets steeper the closer you get to the edge. The rate of decay, measured by Theta, picks up speed dramatically as the expiration date gets closer.
This acceleration really kicks into high gear for at-the-money (ATM) options in the last 30-45 days of their life. During that final month, the ice cube starts melting much faster. For a deeper dive into this, check out our guide on time decay in options.
This accelerating curve has massive implications for your strategy:
- For Buyers: Holding a long option into its final few weeks is a huge gamble unless you’re expecting a massive, immediate move. That daily Theta burn can wipe out your position in a hurry.
- For Sellers: The last month before expiration is the prime time for collecting premium. This is when Theta decay is working its hardest for you, letting you capture value at a much faster rate.
The effect becomes even more extreme in the final week. An at-the-money option can lose up to 30% of its remaining value from Theta alone in the last week before it expires.
Understanding Theta isn't just about knowing that options lose value over time. It’s about knowing when they lose that value most aggressively, so you can position yourself on the right side of that decay. Whether you're buying time or selling it, Theta is a force you absolutely can't afford to ignore.
How Vega Measures Your Volatility Exposure
While Delta, Gamma, and Theta track price and time, Vega is what makes an option's price feel alive. It measures how sensitive your option is to a 1% change in the underlying stock's implied volatility (IV).
Think of an option's potential as an accordion. When implied volatility rises, it's like stretching the accordion—the range of possible outcomes widens, and the option's premium inflates. When IV falls, the accordion squeezes shut, and the premium deflates.
Vega tells you exactly how much your option's price will change with each stretch or squeeze. An option with a Vega of 0.10 will gain $10 in value for every 1% jump in IV. If IV drops by 1%, that same option loses $10. This makes Vega a huge factor, especially around big market-moving events.
Implied Volatility vs. Historical Volatility
To really get Vega, you have to know the difference between the two flavors of volatility:
Historical Volatility (HV): This is backward-looking. It’s a simple calculation of how much a stock’s price has bounced around over the last 30 or 90 days. It's a fact, not a prediction.
Implied Volatility (IV): This is what really matters to options traders. It’s forward-looking, representing the market’s best guess of how much a stock will move in the future. It’s baked right into the option's price.
IV is pure market sentiment—it’s the collective fear, greed, and uncertainty of every trader. When a big event like an earnings report is coming up, uncertainty skyrockets, and so does IV. That pre-event pump in option prices is all Vega.
The Dreaded Volatility Crush
Every new options trader learns about the "volatility crush" (or "vol crush") the hard way. It’s what happens when implied volatility collapses after a big, known event is over. The uncertainty is gone, so IV falls back to earth.
Imagine you buy a call right before an earnings report, betting the stock will soar. The company reports amazing news, and the stock jumps just like you wanted. But when you check your P&L, you’ve barely made any money—or maybe you even lost.
What happened? The massive drop in IV after the news crushed your option’s premium. The gains you made from the stock’s direction (Delta) were eaten alive by the collapsing volatility. That’s Vega risk in its most brutal form.
Key Insight: Being right on direction isn't enough. When you buy options with sky-high IV, you're also betting that volatility will stay high or go even higher.
Using Vega to Your Advantage
Understanding Vega isn’t just about dodging bullets; it’s about finding opportunities. For a more comprehensive look, you can read our detailed article on what Vega is in options.
Smart traders use Vega in a couple of key ways:
Buying Options When IV is Low: If you think a stock is ready for a big move but IV is sleeping, buying calls or puts can be a fantastic play. You get in before the market starts pricing in the excitement, setting yourself up to profit from both the directional move (Delta) and an IV spike (Vega).
Selling Options When IV is High: The flip side is selling options when IV is through the roof. You collect a fat premium pumped up by market fear and then wait for things to calm down. This is the core idea behind strategies like selling strangles or iron condors around earnings.
Before we move on, let's look at how common market events influence an option's value through Vega.
How Market Events Impact Implied Volatility And Vega
| Market Event | Impact on Implied Volatility (IV) | Effect on Long Option Positions (via Vega) |
|---|---|---|
| Upcoming Earnings Report | IV tends to rise significantly as uncertainty builds. | Positive. Higher IV inflates the option's premium. |
| Post-Earnings Announcement | IV typically "crushes" or collapses back to normal levels. | Negative. The sharp drop in IV deflates the premium. |
| Major Economic News | Unexpected news can cause a rapid spike in broad market IV. | Positive. A sudden increase in fear boosts option values. |
| Period of Low Market Activity | IV may drift lower due to a lack of catalysts or uncertainty. | Negative. A slow decline in IV erodes the option's value. |
| Sudden Market Panic/Crash | IV skyrockets as fear and panic grip the market. | Strongly Positive. This is where Vega has its biggest impact. |
As the table shows, timing your trades around these volatility shifts is crucial for managing your Vega exposure.
A classic example of Vega's power was the COVID-19 crash in March 2020. IV for countless stocks doubled or even tripled, causing Vega-driven price swings in options of up to 50% in a matter of weeks.
Seeing The Greeks Work Together In Real Time
Knowing what each Greek does is one thing. Watching them all dance together in a live trade? That's where the real magic happens. The Greeks don’t operate in separate silos; they're in a constant conversation, influencing each other as the market breathes. Getting a feel for this interplay is what separates the pros from the pack.
To make this less abstract, let’s walk through a classic options scenario. Picture a trader buying a slightly out-of-the-money call option on a hot tech stock, let’s call it "TechCorp," just two weeks before its quarterly earnings report. This is a common speculative play—a bet on a positive surprise that could send the stock soaring.
This infographic breaks down how a big market event, the resulting change in volatility, and the option's price are all connected.
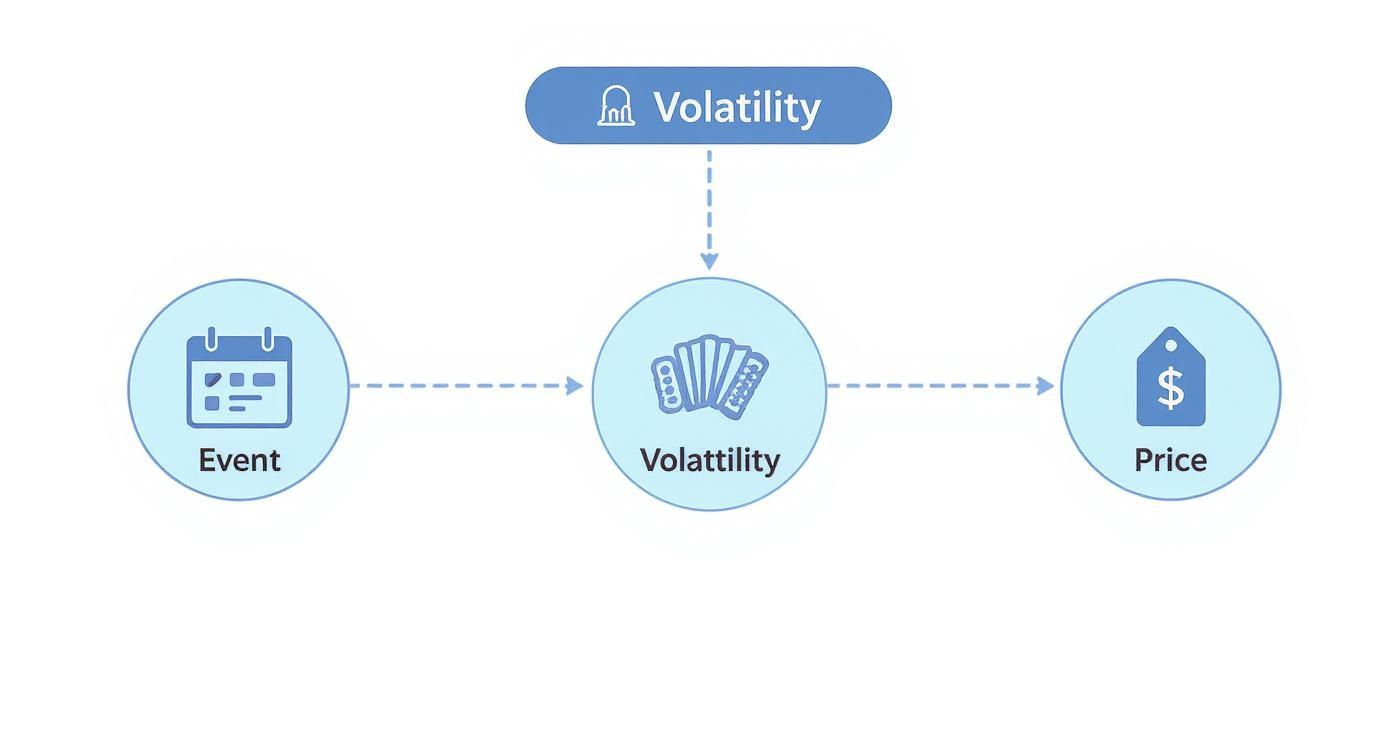
As you can see, a looming event like an earnings announcement cranks up the uncertainty. That uncertainty directly inflates implied volatility, which in turn pumps up the option's price.
The Initial Setup And The Pre-Earnings Drift
Let's give our TechCorp call option some real numbers to start:
- Stock Price: $150
- Strike Price: $155 call
- Days to Expiration: 14
- Delta: 0.40 (Roughly a 40% chance of finishing in-the-money)
- Gamma: 0.08
- Theta: -0.05 (Losing $5 per contract every day to time decay)
- Vega: 0.12 (Gaining $12 for every 1% rise in implied volatility)
In the days leading up to the earnings call, two main forces are battling it out. First, implied volatility starts to climb as market anxiety builds. This is Vega doing its job. Even if the stock price doesn't budge, our trader’s option gains value simply because the market is pricing in a bigger potential move.
But at the same time, Theta is relentlessly eating away at the option's value. Every single day that ticks by, the option loses a little bit of its time premium. It’s a tense standoff: will the gains from rising IV (Vega) be enough to outpace the daily bleed from time decay (Theta)?
The Stock Makes Its Move
Now, let's say a positive rumor starts making the rounds a few days before the announcement. TechCorp's stock rallies from $150 to $154.
This is where the power of Gamma really shines. As the stock moves up, the option gets closer to being at-the-money. Our initial Delta of 0.40 doesn't just sit there—it starts to accelerate. Thanks to Gamma, the Delta might jump from 0.40 to 0.48.
What does that mean? The option is now far more sensitive to the stock’s movement. For the next dollar the stock moves up, the option will gain $0.48, not the original $0.40. Gamma has basically put a turbocharger on the position's directional bet, making a small move much more profitable.
The Greeks aren't just static numbers on a screen; they are a dynamic dashboard for your trade. They show you how your risk profile is evolving in real time, allowing you to anticipate changes rather than just react to them.
This interaction is the heart and soul of active options management. By watching how a change in stock price impacts Delta and Gamma, and how the approaching earnings date juices up Vega while speeding up Theta decay, a trader gets the full risk picture. You're not just managing one variable—you're navigating all the forces that are shaping your trade's outcome.
Common Questions About Options Greeks
Even after breaking down each Greek one by one, a few questions always pop up as traders start to put these ideas into practice. Getting straight answers to these can make all the difference in building your confidence.
Let's tackle the most common questions head-on.
Which Greek Is Most Important For A Beginner To Learn?
**Delta.## Common Questions About Options Greeks
Even after breaking down each Greek one by one, a few questions always pop up as traders start to put these ideas into practice. Getting straight answers to these can make all the difference in building your confidence.
Let's tackle the most common questions head-on.
Which Greek Is Most Important For A Beginner To Learn?
Delta. Hands down, it's the most important Greek to get a handle on first.
It gives you a direct answer to the most fundamental question: "How much will my option's price change if the stock moves $1?" Grasping Delta gives you a solid foundation for understanding your directional risk and even the probability of a trade working out. While you need all of them for the full picture, Delta is the perfect starting point.
Can Greek Values Be Negative?
Absolutely, and it’s critical to understand why. Put options, for example, have a negative Delta because they gain value as the underlying stock price falls.
Theta is almost always negative for any option you buy (long calls or puts) because that relentless time decay is working against you as the clock ticks down.
But for option sellers, the signs flip.
Selling a call option, for instance, gives you a negative Delta but a positive Theta. This setup means you make money if the stock price drops and as time passes, because now time decay is working in your favor.
Where Can I Find The Greek Values For An Option?
Just about any modern brokerage platform will show you the Greeks right in their options chain. You'll usually see columns for Delta, Gamma, Theta, and Vega sitting right next to an option's bid and ask prices.
These numbers are constantly being recalculated and are essential for analyzing any trade. If you don't see them, check your platform's column or layout settings—you should be able to switch them on easily.
Ready to stop guessing and start trading with data-driven confidence? Strike Price provides real-time probability metrics and smart alerts to help you master your covered call and secured put strategies. Turn complex data into clear, actionable insights and start earning consistent income today. Learn more at Strike Price.