A Practical Guide to the Valuation of Options
If a stock moves past your strike, the option can be assigned — meaning you'll have to sell (in a call) or buy (in a put). Knowing the assignment probability ahead of time is key to managing risk.
Posted by
Related reading
A Step-by-Step Covered Calls Example for Consistent Income
Unlock consistent income with our step-by-step covered calls example. This guide breaks down the strategy, risks, and outcomes to help you trade confidently.
Long Call and Short Put The Ultimate Synthetic Stock Guide
Unlock the power of the long call and short put strategy. This guide explains how synthetic long stock works, its benefits, risks, and how to execute it.
What is a Call Spread? A Clear Guide to Bull and Bear Spreads
What is a call spread? Discover how bull and bear spreads limit risk and sharpen your options trading strategy.
Valuing an option is just figuring out the fair price for a contract that gives you the right—but not the obligation—to buy or sell something later. It's a lot like trying to price a ticket for a big concert six months from now. The ticket's value depends on the band's current buzz (stock price), your seat location (strike price), how much time is left before the show, and how much hype (volatility) surrounds the event. The whole process is a blend of hard math and what the market is feeling.
Why Option Valuation Is More Than Just Math

Look at a live option chain for the first time, and it’s easy to feel lost. You’ve got dozens of strike prices and expiration dates, each with its own bid and ask that flicker and change every second. It’s natural to think some impossibly complex formula is running the show. And while sophisticated models are definitely at work, the core idea behind the valuation of options is way more intuitive than it looks.
At its heart, valuing an option is about putting a price on uncertainty. It’s not about what a stock is worth today. It’s about what it could be worth next week, next month, or next year. This is where we move past simple arithmetic and into the world of probabilities and market psychology.
The Two Halves of an Option's Price
Every option's price is made of two distinct parts. One piece is its real, tangible value right now. The other is its potential—the value driven by time and what everyone expects to happen next. To really get a handle on option valuation, you have to see how these two forces play off each other.
Intrinsic Value: This is the straightforward part. The "in-the-money" value. If a stock is trading at $105 and you own a call option to buy it at $100, its intrinsic value is $5. Simple. It's the profit you could lock in this very second.
Extrinsic Value: This is the what if value. It's the premium you pay for the chance that the option could become even more profitable down the road. This value is shaped by time decay, interest rates, and the big one: volatility.
Think of it like this: Intrinsic value is what the option is worth if you cashed it in right now. Extrinsic value is what the market thinks it could be worth in the future.
This guide will pull back the curtain on how pros approach the valuation of options. We’ll break down these core ideas and get into the models they use, like Black-Scholes, to turn market variables into a single, fair price. You'll quickly see that it's less about memorizing formulas and more about understanding the dance between price, time, and probability.
Understanding an Option's Two Sources of Value
Every option's price is a mix of two core ingredients. Think of it as a whole made of two very different parts.
First, you have intrinsic value. This is the straightforward, "right now" value. It’s what the option would be worth if you could cash it in this very second.
For instance, if a stock is trading at $55 and you’re holding a call option with a $50 strike, that option has an intrinsic value of $5. It's the tangible, in-the-money amount. No guesswork involved.
The second piece of the puzzle is extrinsic value. You'll often hear traders call this "time value," and for good reason. It’s the value of possibility—what could happen between now and when the option expires.
This part is more like paying for a lottery ticket. You're buying the chance that the stock will move in your favor. Extrinsic value is shaped by things like time, market volatility, and even interest rates.
To really get a handle on options pricing, you have to understand how both of these components work together.
Intrinsic Value vs Extrinsic Value at a Glance
Breaking down an option's premium into its two parts helps clarify what you're actually paying for. Is it for immediate, tangible value, or are you paying for time and potential?
The table below offers a simple side-by-side comparison.
| Attribute | Intrinsic Value | Extrinsic Value |
|---|---|---|
| Definition | The cash-in-hand value if exercised right now. | The premium you pay for time, volatility, and potential. |
| Calculation | Stock Price minus Strike Price (if in-the-money). | Total Premium minus Intrinsic Value. |
| Drivers | How far the stock price is past the strike price. | Time to expiration, Volatility, and Interest Rates. |
This comparison makes it clear why an option's price is often much higher than its immediate exercise value. You're paying for what could happen.
But remember, that potential doesn't last forever. Extrinsic value melts away over time in a process traders call "theta decay." As the expiration date gets closer, that lottery ticket gets cheaper and cheaper until it's worth nothing.
Key Insight: When an option is far from its expiration date, time and volatility can make up more than 90% of its total price.
Factors Driving Extrinsic Value
So, what exactly fuels this "time value"? It boils down to a few key drivers.
- Time Until Expiration: Simple enough. More time on the clock means more opportunities for the stock to make a big move in your favor.
- Market Volatility: The bigger the expected price swings, the more valuable the chance of a big payoff becomes. Higher volatility pumps up the premium.
- Interest Rates: A bit more behind the scenes, but higher rates can increase the cost of carrying the underlying stock, which subtly pushes option premiums higher.
Dividends also play a role, as they tend to reduce the stock's price, which can affect the extrinsic value of calls. Understanding how these inputs work is the secret to getting a feel for more advanced models like Black-Scholes.
You can learn more about how the stock price and strike price relationship shapes an option's value in our guide on Moneyness In Options.
Skilled traders are constantly watching these factors, looking for options that might be mispriced based on their view of the future.
Practical Example Of Value Components
Let's make this real.
Imagine you're looking at a call option on a $100 stock with a $105 strike price that expires in three months. The option is currently trading for $4.
Right away, you know its intrinsic value is $0. The option is out-of-the-money, so there's no immediate cash-in value.
That means the entire $4 premium is pure extrinsic value. It’s the price you pay for three months of uncertainty and the possibility of the stock climbing past $105.
Now, what if the market suddenly gets nervous and volatility spikes by 20%? Even if the stock price doesn't budge from $100, that option's premium might jump from $4 to $6. That entire increase is fueled by extrinsic value.
This is why dissecting an option's price is so important. It gives you true clarity on what you’re paying for—guaranteed value or speculative potential. Once you see it this way, you can start picking strikes that perfectly balance the two for your strategy.
Decoding the Most Common Option Pricing Models
Now that we have a solid grip on what makes up an option's value, we can dive into the tools traders use every day for the valuation of options. These pricing models aren't magic black boxes; they're just logical frameworks built to turn a bunch of market variables into a fair price. They give us a structured way to put a number on uncertainty.
We'll start with one of the most intuitive models out there: the Binomial model.
The Binomial Model: A Simple Decision Tree
Think of the Binomial model as a step-by-step decision tree. It’s a powerful way to visualize how an option's price is built from a series of probabilities. Instead of trying to guess a stock's exact future price, it just maps out potential paths over time, assuming only two outcomes at each step: a move up or a move down.
From there, it’s a process of working backward. The model calculates the option's potential payoff at every single endpoint on that tree, then discounts those future values all the way back to today to arrive at a fair price.
For example, say a stock is trading at $100. The model might assume that in one month, it can only go up to $110 or down to $90. It then repeats that process for the next month, and the next, creating a branching tree of all possible price paths until the option expires. It’s simple, but it perfectly illustrates how an option's value is derived from all its potential future states.
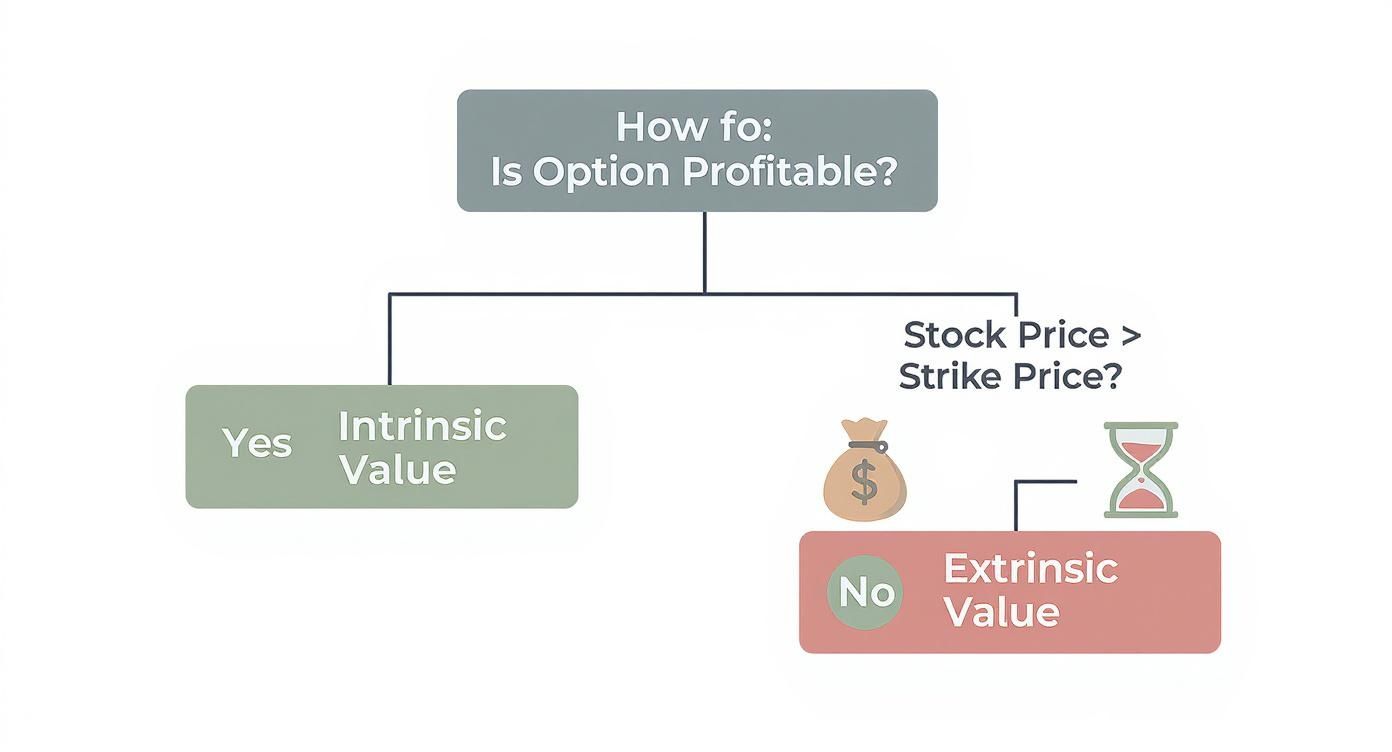
This visual breaks down how an option’s profitability really comes down to the relationship between the stock price and the strike, separating its real, tangible value from its time-based potential.
The Black-Scholes-Merton Model: A Sophisticated Calculator
Next up is the big one: the Black-Scholes-Merton (BSM) model. It’s the most famous tool for the valuation of options, and while the formula itself looks pretty intimidating, it’s best to think of it as a sophisticated calculator. It takes the same step-by-step logic of the Binomial model but makes it continuous, assuming price movements are fluid instead of happening in discrete jumps.
The arrival of models like Black-Scholes helped fuel the massive growth of the options market. To put it in perspective, back in 2000, the average daily trading volume for single-stock options in the U.S. was around 2 million contracts. By 2022, that number had exploded to over 40 million contracts a day. The BSM model's real influence is that it provides a standardized framework that everyone in the market can use as a common reference point.
Key Takeaway: The Black-Scholes model isn't just for finding a price. Traders often use it backward to solve for "implied volatility," which tells you what the market collectively thinks about a stock's future price swings.
The model is powered by five critical inputs:
- Current Stock Price: This is the starting line. A higher stock price makes a call option more valuable and a put option less valuable.
- Strike Price: This is the fixed anchor point—the price where the option can be exercised.
- Time to Expiration: How much time is left on the clock. More time almost always means more extrinsic value for both calls and puts.
- Risk-Free Interest Rate: Think of this as the return you could get on a "no-risk" investment like a U.S. Treasury bill. Higher rates give call values a slight boost and reduce put values.
- Volatility: This is the big one—the most crucial and the only subjective input. It’s the market’s best guess on how much a stock’s price will fluctuate. Higher volatility makes all options more valuable because it expands the range of possible outcomes.
Interestingly, many of the core ideas used in option valuation, especially the analytical tools baked into these pricing models, are also fundamental when you're learning how to value stocks and shares.
By crunching these five variables, the Black-Scholes model gives us a logical and consistent way to determine an option's fair price, turning the abstract idea of future possibility into a concrete dollar value.
How Volatility Shapes an Option's Price
If an option's price is a recipe, volatility is the secret ingredient that gives it its kick. While things like the stock price and time left on the clock are pretty straightforward, volatility is more like the market's collective gut feeling about the future. Getting a handle on this is non-negotiable for any real valuation of options.
In simple terms, volatility just measures how much a stock’s price is expected to jump around. A sleepy, stable stock has low volatility. A stock that makes wild, unpredictable moves has high volatility. This uncertainty is what directly fuels an option's extrinsic value—bigger swings mean more chances for an option to pay off big.
Historical vs Implied Volatility
To really value an option correctly, you have to know the difference between two kinds of volatility. Think of it like weather forecasting: one looks at the past, and the other tries to predict the future.
Historical Volatility (HV): This is purely backward-looking. It tells you how much the stock's price actually moved over a set period, like the last 30 or 90 days. It's the recorded history of what already happened.
Implied Volatility (IV): This is the one that really matters for pricing. It's a forward-looking guess that's baked right into an option's current market price. IV is the market's best guess on how much the stock is expected to move from here on out.
We break down how this critical number is calculated in our guide on how to calculate implied volatility. If historical volatility is a log of last month's rainfall, implied volatility is today's forecast—and the forecast is what sets the price of an umbrella.
Why Implied Volatility Is the Market's Fear Gauge
There's a reason traders often call implied volatility the "fear gauge." It’s a direct reflection of uncertainty and anxiety in the market. When traders think a big event could send a stock flying—in either direction—they start bidding up the price of options, which pushes implied volatility higher.
This is why you'll see IV spike right before major events like:
- Company earnings announcements
- Key economic data releases
- Big regulatory decisions
When the market is truly stressed, this effect gets amplified. Look at the 2008-2009 Global Financial Crisis. The VIX, which tracks the S&P 500's implied volatility, shot up past 80. Its long-term average is closer to 20. That massive spike in fear made options, especially puts, incredibly expensive as the market priced in pure chaos.
Key Insight: Higher implied volatility makes both calls and puts more expensive. It widens the cone of possible outcomes, which makes the chance of an option finishing deep in-the-money much more valuable.
Understanding Volatility Crush
So what happens after the big event passes? The earnings report is out, the news has dropped, and all that uncertainty just… vanishes. The future is suddenly a lot clearer.
This rapid evaporation of uncertainty causes implied volatility to collapse. We call this volatility crush.
Imagine an option the day before earnings. It’s expensive because IV is sky-high. The second the numbers are released, IV can get cut in half—sometimes by 50% or more. Even if the stock moves in your favor, that nosedive in volatility can crush the option's premium, often leaving the option buyer with a loss.
To really get why this all matters, it helps to have a broader understanding market volatility in general. It’s the dynamic, unpredictable force that breathes life—and risk—into every single contract. Mastering it is essential for anyone serious about the valuation of options.
Using The Greeks To Manage Your Option Positions
If an option’s price is the final destination, think of the “Greeks” as the real-time instruments on your dashboard telling you how you’re getting there. They aren't just abstract formulas; they're practical tools for measuring risk, and understanding them is essential for any serious approach to the valuation of options.
Each Greek isolates one specific risk factor, showing you exactly how sensitive your option’s price is to a change in that variable. Think of them as your trade’s vital signs. They tell you how your position will react to shifts in the stock price, the simple passage of time, or swings in market sentiment.
Delta: The Speedometer of Your Option
Delta is the first and most intuitive Greek. It tells you how much an option's price is expected to change for every $1 move in the underlying stock. It's the speedometer for your position.
A call option with a delta of 0.60 will gain roughly $0.60 for every $1 the stock climbs. On the flip side, it'll lose $0.60 for every $1 the stock drops.
- Call options have a positive delta (ranging from 0 to 1.0).
- Put options have a negative delta (ranging from 0 to -1.0).
An at-the-money option usually has a delta around 0.50, meaning its price moves about half as much as the stock. As the option gets deeper in-the-money, its delta creeps toward 1.0, behaving almost identically to the stock itself.
Gamma: The Accelerator Pedal
If delta is your speed, then gamma is your acceleration. It measures the rate of change in an option's delta. Put simply, gamma tells you how fast your speedometer's needle will move as the stock price changes.
Options with high gamma are incredibly responsive. This is most common for at-the-money options that are close to expiration, where a small move in the stock can cause their delta to swing wildly from near 0 to near 1.0.
Key Takeaway: Gamma is highest for at-the-money options and drops off as an option moves further in- or out-of-the-money. This "gamma risk" is a critical factor traders manage, especially as expiration gets closer.
Theta: The Inevitable Countdown Timer
Theta represents the unavoidable impact of time decay. It’s the countdown timer, showing you how much value an option loses each day just because time is passing. For anyone holding a long option, theta is always a negative number because time is an asset that's constantly being spent.
An option with a theta of -0.05 will bleed about $0.05 of its extrinsic value every single day, assuming nothing else changes.
This decay isn't a straight line—it accelerates. The rate of decay gets much faster as an option nears its expiration date. This is why holding a short-term option is often compared to holding a "melting ice cube." Its value is constantly dripping away.
Vega: The Volatility Sensor
Finally, Vega measures an option's sensitivity to changes in implied volatility (IV). It’s your position’s volatility sensor, telling you how much the option's price will move for every 1% change in IV.
An option with a vega of 0.10 will gain $0.10 if implied volatility ticks up by 1%. It'll lose that same $0.10 if IV falls by 1%.
Vega is highest for long-term options, since more time allows for more potential price swings. Understanding vega is crucial for trading around events that cause big shifts in market fear or greed, like earnings reports.
To make these concepts even clearer, here’s a quick-glance table.
Quick Guide to The Option Greeks
This table breaks down what each of the primary Greeks measures, giving you a simple way to remember their role.
| Greek | What It Measures | Simple Analogy |
|---|---|---|
| Delta | Sensitivity to a $1 change in the underlying stock price | The Speedometer |
| Gamma | Rate of change in Delta | The Accelerator |
| Theta | Sensitivity to the passage of time (time decay) | The Countdown Timer |
| Vega | Sensitivity to a 1% change in implied volatility | The Volatility Sensor |
By using these four Greeks, you can move beyond simply guessing an option’s direction. You start managing your positions with a clear view of every risk on your dashboard, just like a professional. For a deeper dive, check out our complete guide to options trading Greeks.
Common Questions About Valuing Options
Even with a solid grasp of the models and the Greeks, some practical questions always pop up when you try to apply these ideas in the real world. Let's tackle a few of the most common ones to clear up any lingering confusion.
Think of this as the final check-in, where we bridge the gap between textbook theory and street-smart trading.
Why Is The Black-Scholes Model Still Used If It Has Known Limitations?
It’s a fair question. The Black-Scholes model is built on assumptions that don't always hold up in the real market, like constant volatility or perfectly efficient markets. So why has it been an industry cornerstone for decades?
The answer is simple: its main job isn't to spit out a "correct" price. Its real power is providing a universal baseline for interpreting what the market is thinking. Think of it less as a flawless price predictor and more as a tool for reverse-engineering market sentiment.
Traders use it to calculate implied volatility (IV). When an option's market price is higher than what the model predicts, it tells you the market is pricing in more future uncertainty—more "what ifs"—than historical data alone would suggest.
In short, traders work backward. They plug in the known market price to solve for the one big unknown: volatility. This makes the model an indispensable gauge of market consensus, not just a simple calculator.
This shared framework lets everyone speak the same language. When a trader says IV is at 40%, they're referencing a value derived from this common model. It creates a consistent benchmark for comparing options across different stocks and timeframes.
Can I Value Options Accurately Without Complex Software?
Absolutely. You don't need an expensive, institutional-grade software subscription to get a solid, actionable estimate of an option's fair value. It’s all about understanding the inputs, not running complex code.
If you're using a Binomial tree model, for instance, a simple spreadsheet is all you need to map out the potential price paths. It’s a fantastic way to visually grasp how an option’s value builds up over its life.
And for Black-Scholes? The good news is most online brokers offer free, built-in calculators. You just need to plug in the five key variables. The most important (and trickiest) one is always volatility.
Here's a practical shortcut: just use the implied volatility figure your broker already provides for a similar option on the same stock. This number reflects the market's current consensus, and it's almost always a better input than plugging in historical volatility. It might not be as precise as a professional setup, but it’s more than enough for a retail investor to judge if an option is reasonably priced.
How Do Stock Splits Or Special Dividends Affect Option Values?
Corporate actions like stock splits or big, one-off dividends could throw a wrench in option contracts if there weren't rules in place. Luckily, the exchanges have standardized procedures to keep things fair for everyone.
The goal of these adjustments is to ensure the total value of your option position remains the same before and after the event.
Here’s a quick rundown of how it usually works:
- Stock Splits: For a typical 2-for-1 stock split, your option contract gets adjusted to control twice the number of shares (from 100 to 200) at half the original strike price. The total value of your position stays put.
- Special Dividends: When a company issues a large, unexpected dividend, the stock price is expected to drop by that amount on the ex-dividend date. To protect call holders (who don't get the dividend), the exchange will typically lower the option's strike price by the exact dividend amount.
These adjustments happen automatically and are vital for preventing one side of the trade from getting an unfair advantage. They keep the market orderly and ensure the principles of option valuation apply consistently, even when the underlying stock goes through a major change.
Ready to stop guessing and start making data-driven decisions? Strike Price provides real-time probability metrics for every strike price, empowering you to sell covered calls and secured puts with confidence. Get smart alerts, track your performance, and find tailored strategies that match your income goals and risk tolerance. Join thousands of traders turning options selling into a strategic, income-generating process.