What Is Bid Offer Spread in Trading
If a stock moves past your strike, the option can be assigned — meaning you'll have to sell (in a call) or buy (in a put). Knowing the assignment probability ahead of time is key to managing risk.
Posted by
Related reading
A Step-by-Step Covered Calls Example for Consistent Income
Unlock consistent income with our step-by-step covered calls example. This guide breaks down the strategy, risks, and outcomes to help you trade confidently.
Long Call and Short Put The Ultimate Synthetic Stock Guide
Unlock the power of the long call and short put strategy. This guide explains how synthetic long stock works, its benefits, risks, and how to execute it.
What is a Call Spread? A Clear Guide to Bull and Bear Spreads
What is a call spread? Discover how bull and bear spreads limit risk and sharpen your options trading strategy.
Ever glanced at a stock quote and seen two prices listed side-by-side? That’s not a typo. The small gap between those two numbers is the bid-offer spread, and it's one of the most fundamental—and often overlooked—costs of trading.
At its core, the spread is the difference between the highest price a buyer is willing to pay for something (the bid) and the lowest price a seller is willing to accept (the offer). This gap is how market makers, the financial middlemen who keep markets flowing, get paid for their work.
What Is the Bid Offer Spread in Simple Terms

Think about it like a currency exchange booth at the airport. They'll buy your dollars for one price and sell them back to you for a slightly higher price. That difference is their profit for providing the convenience of an instant transaction. The financial markets work in a very similar way.
Here’s the breakdown:
- The Bid Price: This is the highest price a buyer on the market is currently willing to pay. If you want to sell your shares right now, this is the price you'll get.
- The Offer (or Ask) Price: This is the lowest price a seller is willing to accept. If you want to buy shares right now, this is the price you'll pay.
The spread is simply the difference between those two numbers. It’s the built-in cost of immediacy. For a deeper look into the mechanics that drive markets, you can explore further insights into financial market knowledge.
To make it even clearer, here's a quick summary of the two sides of the spread.
Bid vs Offer At a Glance
| Term | Who Places It | What It Represents |
|---|---|---|
| Bid | Buyer | The highest price a buyer will pay |
| Offer | Seller | The lowest price a seller will accept |
This dynamic is central to how markets function.
Whether you're trading stocks, ETFs, or more complex instruments, this concept is always at play. Understanding how spreads work in derivatives is especially important, and learning about how options work provides great context on the mechanics involved.
How to Calculate the Bid Offer Spread
Figuring out the bid-offer spread is surprisingly simple. It all boils down to one quick subtraction that shows you the hidden cost of a trade. No complex formulas or fancy software needed—just the two prices you see on your screen.
The formula is as straightforward as it gets:
Offer Price - Bid Price = Spread
That’s it. You just subtract the highest price a buyer is willing to pay (the bid) from the lowest price a seller is willing to accept (the offer), and the difference is your spread.
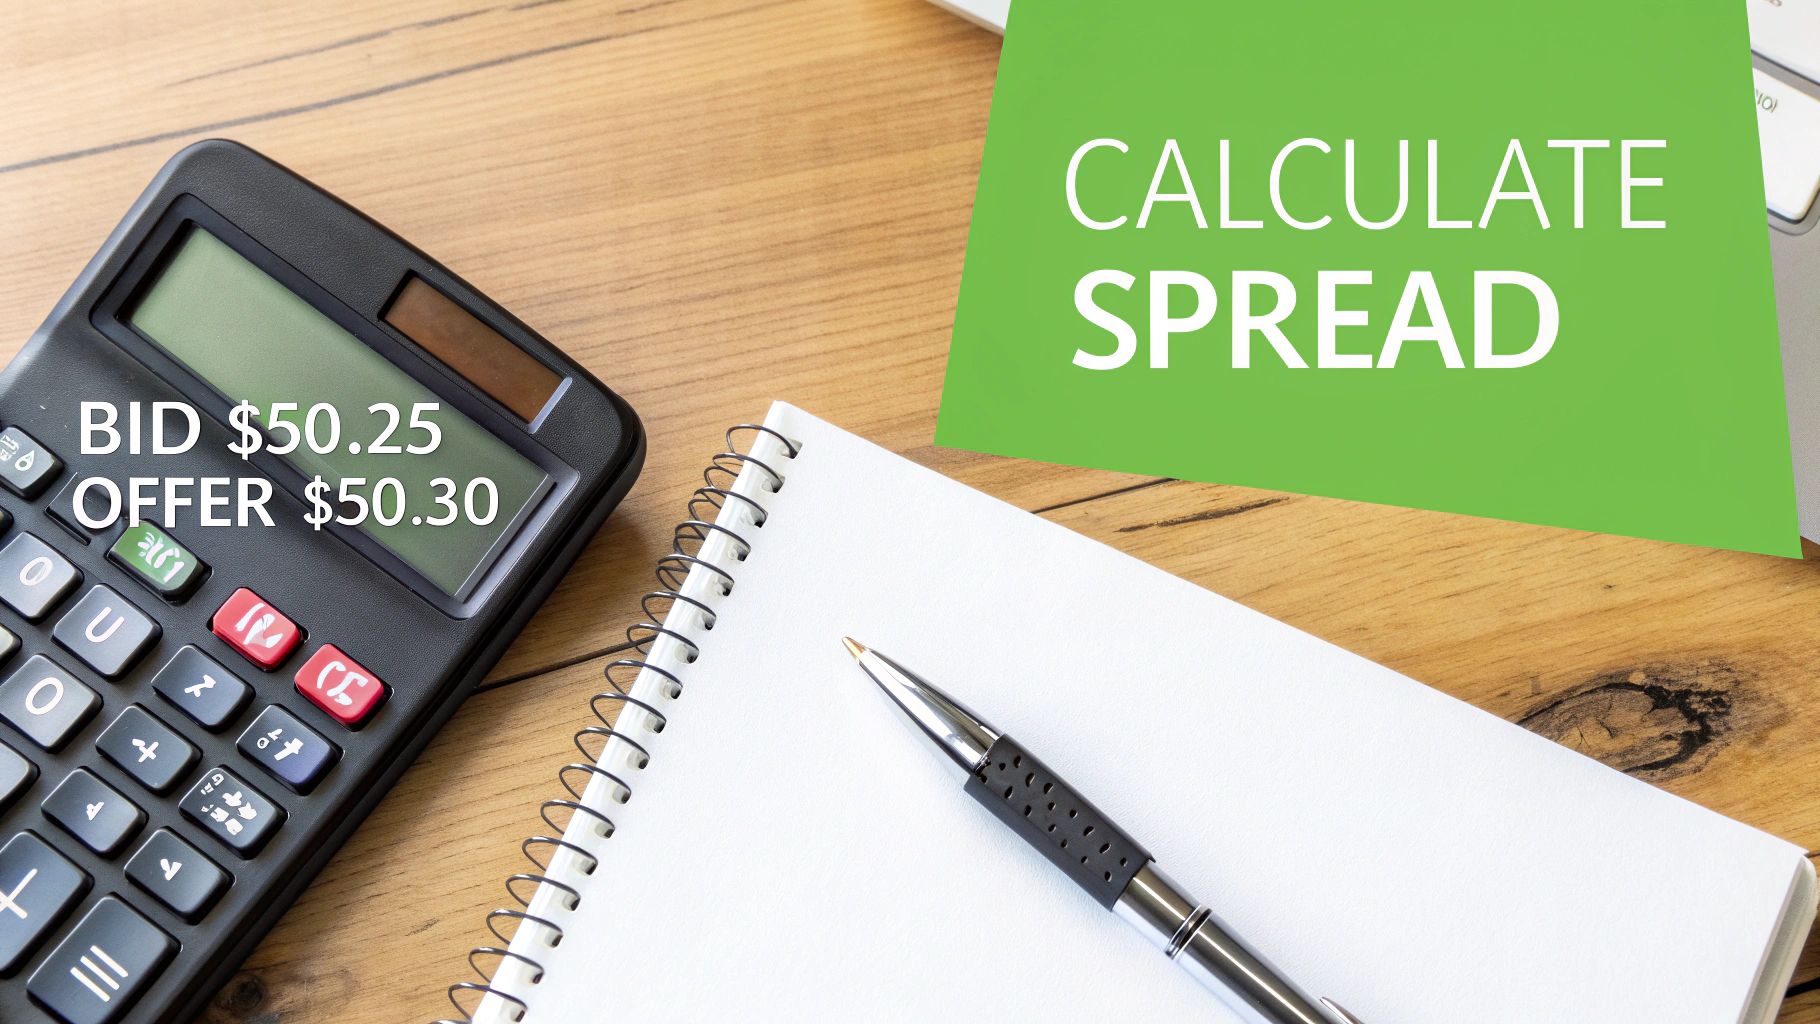
A Real-World Stock Example
Let’s put this into practice. Imagine you're looking at a quote for a fictional company, Innovate Corp. (INV), and your trading platform shows these prices:
- Bid Price: $50.25
- Offer Price: $50.30
Using the formula, the math is simple:
$50.30 (Offer) - $50.25 (Bid) = $0.05 (Spread)
This means there's a five-cent cost baked into every share you trade. While that might not sound like much, it's the key to understanding the true cost of getting into—and out of—any position.
The spread isn’t just a number; it’s the price you pay for immediate market access. A trader always buys at the higher offer price but can only sell at the lower bid price, making the spread an instant hurdle to clear before you can turn a profit.
Turning the Spread into a Percentage
To really compare trading costs between different assets, it helps to look at the spread as a percentage. This gives you a sense of its relative impact, whether you’re trading a $50 stock or a $5 one.
The formula for this is: (Spread / Offer Price) * 100
Let’s go back to our Innovate Corp. example:
($0.05 / $50.30) * 100 = 0.099%
This percentage is a powerful yardstick. It quickly shows you that a $0.05 spread on a $50 stock is proportionally much smaller than the same $0.05 spread on a $5 stock. The same logic is crucial when you want to learn how to read option chains, where comparing percentage spreads can instantly reveal liquidity differences between contracts.
Why the Spread Is a Vital Sign of Market Health
The bid-offer spread is way more than just a transaction cost—it's one of the best real-time indicators of a market's overall health. Think of it like a pulse. A strong, steady pulse signals good health, while a weak or erratic one hints at bigger problems.
In the market, a narrow or 'tight' spread is that steady pulse. It tells you the market is healthy and liquid, like a bustling digital marketplace packed with buyers and sellers. All that activity means trades can get done easily and cheaply, which reflects stability and confident investors.
Liquidity and Risk Signals
On the flip side, a wide spread is a flashing yellow light. It signals poor liquidity, meaning there aren't as many people trading, and finding someone to take the other side of your trade is harder. You’ll often see this with less popular assets, like small-cap stocks, or when the entire market gets nervous.
When volatility spikes, market makers widen spreads to protect themselves from risk. For a trader, that wide spread means a few things:
- Higher Costs: It simply costs you more to get in and out of a position.
- Increased Risk: It’s a sign of potential instability or just low interest in that particular asset.
- Execution Headaches: Your orders might take longer to fill, or you might get a worse price than you expected.
The bid-offer spread is the market's way of talking to you. A tight spread says, "Come on in, the water's fine." A wide spread cautions, "Proceed with care; conditions are choppy."
This idea holds true for any asset. In super liquid markets like major currency pairs, the spread can be razor-thin because supply and demand are massive. But for a less-traded small-cap stock, you might see spreads that are 1-2% of the stock's value, a direct reflection of the higher cost of trading something with low liquidity. For a deeper dive, Optiver explains how market makers use spreads to manage risk.
Getting a feel for this dynamic is a huge advantage. Just by looking at the spread, you can gauge an asset's liquidity and potential risk before you even think about placing a trade. This is especially true for derivatives traders, where tracking real-time options data shows just how quickly liquidity shifts can ripple through contract prices and wreck a profitable setup.
What Makes the Bid Offer Spread Change
The bid-offer spread is anything but static. It’s a living, breathing part of the market that tightens and widens in real-time. A good analogy is surge pricing for a rideshare app—when the roads are clear and demand is normal, the price is predictable. But throw in a sudden storm or a big event, and the cost to get a ride right now shoots up.
It’s the same with trading. Three main forces are constantly at play: liquidity, volatility, and volume. These factors work together, and understanding how they interact is the key to timing your trades better and keeping your execution costs down.
The Impact of Volatility and Liquidity
Of all the drivers, market volatility often has the most dramatic effect on the spread. When things are calm and the market is moving predictably, market makers are confident. They keep spreads tight because their risk is low.
But the moment a big piece of economic news drops or a company releases a surprise earnings report, volatility can spike. This uncertainty is a red flag for market makers. To protect themselves from getting caught on the wrong side of a sudden price swing, they immediately widen the spread.
Think of a wider spread as a built-in risk premium. Market makers are essentially charging more to facilitate trades because there's a higher chance they could lose money in an unpredictable environment.
This relationship between market activity, the spread, and overall market health is pretty direct.
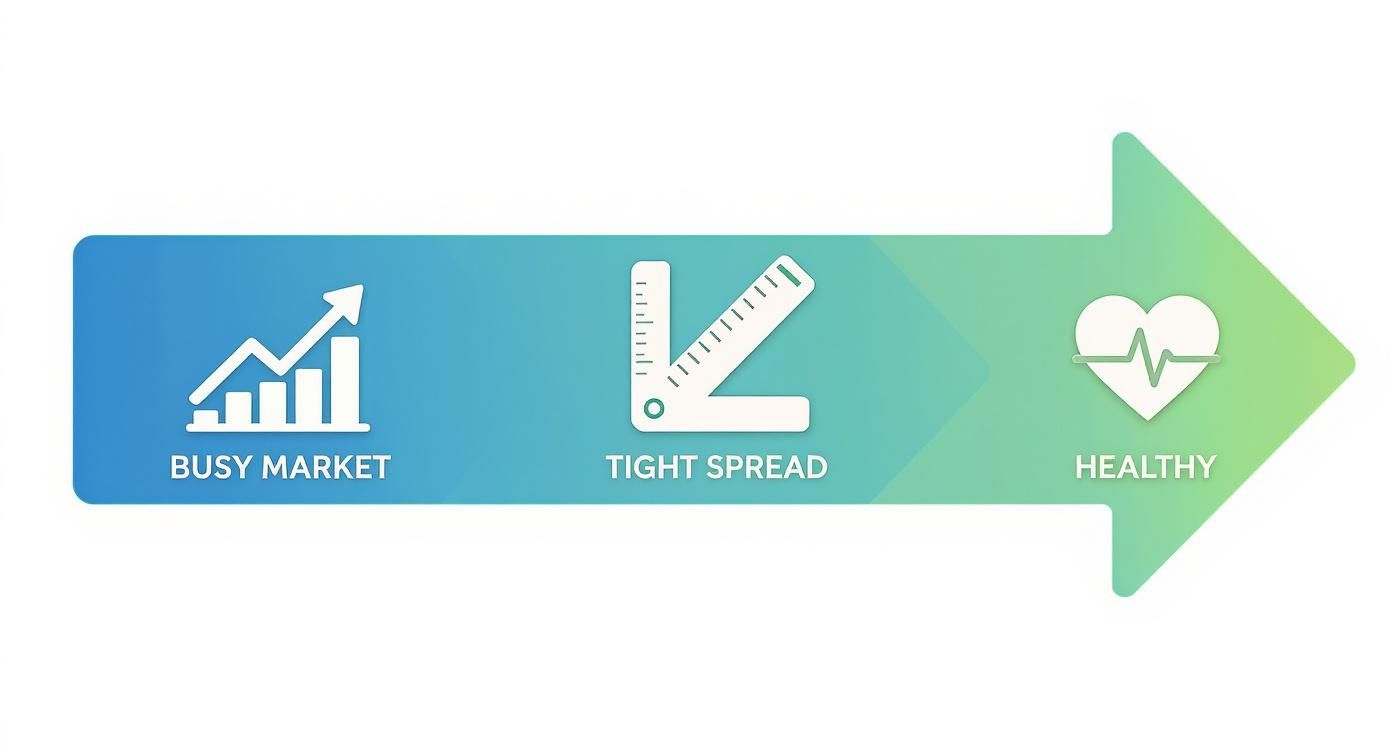
As you can see, a busy market with lots of participants naturally leads to tighter spreads, which is a classic sign of a healthy, efficient market.
How Trading Volume Affects the Spread
Trading volume is the other side of the liquidity coin. It simply measures how many shares or contracts are changing hands over a given period. The connection to the spread is straightforward.
- High Volume: Think about popular, large-cap stocks that trade millions of shares daily. The competition between buyers, sellers, and market makers is fierce. This intense activity forces everyone to offer more competitive prices, squeezing the spread until it's razor-thin.
- Low Volume: Now, consider a small, obscure company. With far fewer people trading the stock, there’s less competition. Market makers don't have to worry about being undercut, so they can maintain a much wider spread.
We’ve seen this play out during major market events. Back in the 2008 financial crisis, for instance, sheer panic caused liquidity to evaporate almost overnight. As volatility soared, bid-ask spreads blew out across the board because no one wanted to take on unnecessary risk.
How the Spread Directly Affects Your Profits

The bid-offer spread isn't just a piece of market theory—it’s a real, direct cost that nibbles away at your bottom line with every single trade. Think of it as the first hurdle you have to clear just to break even.
When you decide to buy an asset, you always pay the higher offer price. But the moment that trade goes through, the asset's immediate market value is the lower bid price. This gap means every new position you open starts with a small, built-in loss.
It's the cost of admission to the market. Before you can even think about making a profit, the asset's price has to climb enough to close that initial gap.
The Spread in Action: A Trading Example
Let's make this real. Say you want to buy 100 shares of a stock, and the quote looks like this:
- Bid: $100.00
- Offer: $100.05
You hit "buy," and your order for 100 shares is filled at the offer price, costing you $10,005 (100 shares x $100.05). If you changed your mind and tried to sell them back one second later, you’d only get $10,000 (100 shares x $100.00).
Just like that, you’re instantly down $5, all because of the spread. For your trade to turn a profit, the stock now has to rise above $100.05.
The bid-offer spread is the market’s tollbooth. You pay a small fee every time you enter or exit a position, making it a critical consideration for both frequent traders and long-term investors.
This cost is especially important when you’re comparing different assets. The spread is a key indicator of liquidity costs. For example, popular large-cap stocks might have tight spreads of just 0.1-0.5% of their price, but a less-traded small-cap stock could have a spread as wide as 1-3%. That difference adds up, which is why checking the spread is a crucial part of managing your trading expenses. For a deeper dive, Bankrate.com offers more insights on how these spreads vary.
If you’re an active trader making dozens of moves a day, these tiny costs can quickly stack up and seriously erode your profits. Even for long-term investors, a wide spread means you’re starting your investment journey further behind, making every cent count from day one.
Common Questions About the Bid-Offer Spread
Even when you've got the basics down, the bid-offer spread can still throw a few curveballs. Let's walk through some of the most common questions traders have. Think of this as clearing up the practical details so you can trade with confidence.
Is the Bid-Offer Spread the Same as Commission?
Nope, they're two totally different costs. The spread is an indirect cost baked right into the market. It's the slice of profit the market maker takes for keeping things liquid.
A commission, on the other hand, is a direct fee your broker charges you for handling your trade. This is a huge deal in the age of "commission-free" trading. While you might not pay a direct fee to your broker, you always pay the spread. It’s just part of the game.
Where Can I See the Current Bid-Offer Spread?
You’ll find it on pretty much any trading platform or financial site with stock quotes. It's not hidden; it’s usually right there in the main quote for any stock or option.
You'll see two prices, side-by-side:
- Bid: The price you can sell at, right now.
- Offer (or Ask): The price you can buy at, right now.
Just subtract the bid from the offer. That little number is the spread—the instant cost of getting your trade done immediately.
The spread isn't some secret number; it's displayed openly on trading platforms. The trick is knowing what it actually means: it's the price you pay for the convenience of instant market access.
Does the Bid-Offer Spread Change?
Yes, constantly. The spread is alive and kicking all day long, reacting in real-time to what the market is doing. It’s not a fixed number.
For example, spreads often get wider during chaotic moments, like the first few minutes after the market opens or when a big economic report drops. When things are calm and lots of shares are trading hands, the spread usually tightens up.
Who Profits From the Bid-Offer Spread?
The main players pocketing the spread are the market makers. These are big financial firms that act as the wholesalers of the stock market. They stand ready to both buy from sellers (at the bid) and sell to buyers (at the offer).
Their business model is simple: buy low, sell high. They buy from you at the lower bid price and sell to someone else at the higher offer price. That tiny difference—the spread—is how they get paid for taking on the risk and making sure there's always someone on the other side of your trade.
Ready to stop guessing and start trading with data on your side? Strike Price provides real-time probability metrics to help you make smarter decisions on your covered call and secured put strategies. Transform your options selling from a gamble into a strategic, income-generating process today.